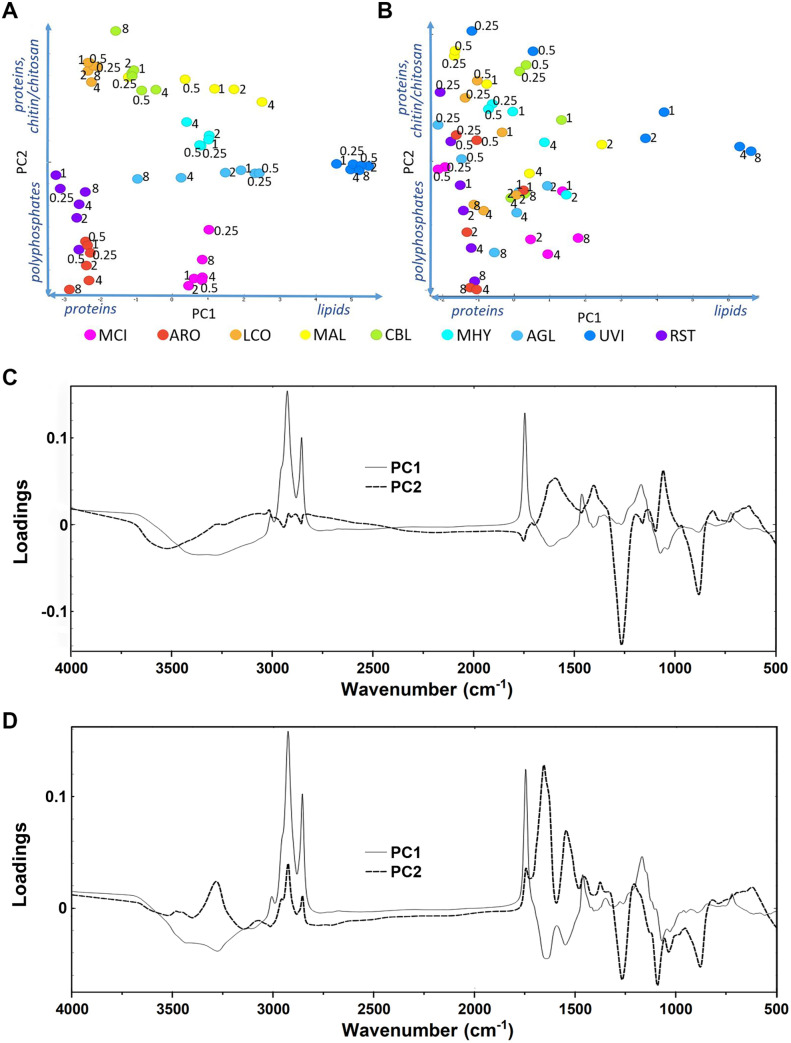
Fig 6.
PCA score plots of FTIR-HTS spectra of fungi grown at different phosphorus concentrations on yeast extract (A) and ammonium sulphate (B). Numbers in PCA score plots indicate the Pi amounts. Vectors on axis describe an observed increase of the metabolites chitin/chitosan, polyphosphates and lipids. Below the scatter plots, loading vectors for PC1 (full line) and PC2 (dashed line) are plotted in C and D, respectively. The explained variance for the first and second principal components are 87% and 7%, respectively, for YE and 69% and 20% for AS.

