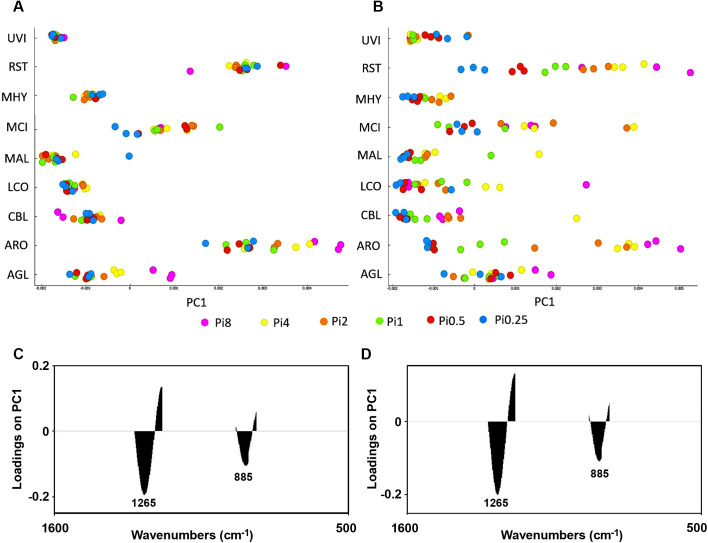
Fig 9.
PCA results (first principal component) for the polyphosphate region (1301–1203 cm-1, 925–842 cm-1) of FTIR-HTS (pre-processed by 2nd derivative and EMSC) spectra of fungi grown on (A) YE-Pi and (B) AS-Pi. The scores for the first component is plotted for all strains in A and B. In A and C, the score plot and the corresponding loading plot are shown for fungi grown on YE-Pi using different Pi levels. In B and D, the score plot and corresponding loading plot are shown for fungi grown on AS-Pi media using different Pi levels. The color coding is according to the Pi levels. The loading plots show that the total polyphosphates content is increasing from the left to the right in both score plots. The explained variance for the first principal component is 95% and 93% for YE and AS, respectively.

