
Fig 10. Variation contribution (%) from changes in N, Pi and N-Pi interaction on the polyphosphate region (1301–1203 cm-1, 925–842 cm-1) of FTIR HTS spectra.
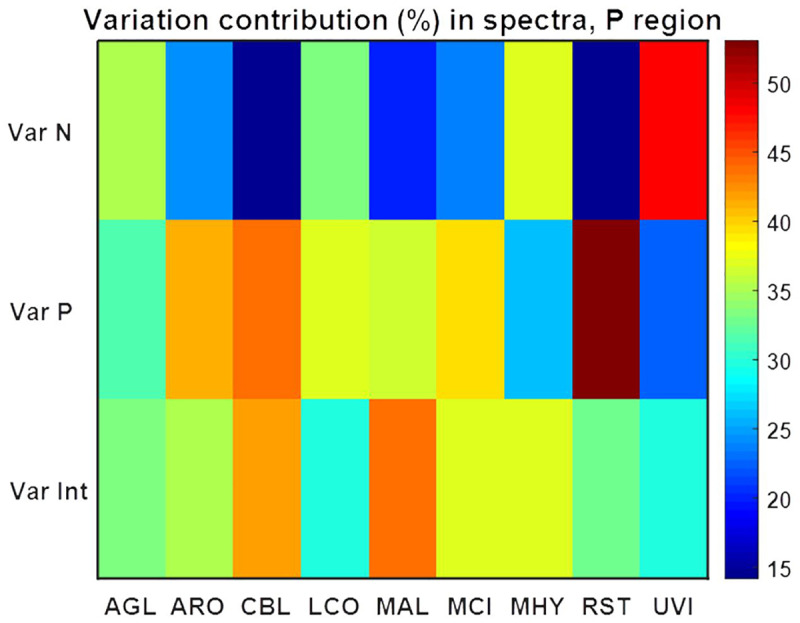
Variation contributions due to N and Pi alone are presented in the first two rows (Var N and Var P), whereas contribution from N-Pi interaction (Int) is presented in the last row (Var Int).