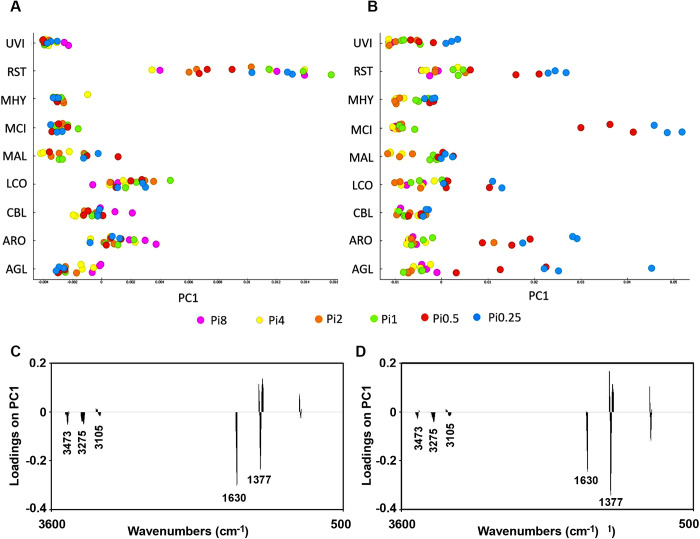
Fig 11.
PCA results (first principal component) for the chitin/chitosan region (3457–3417 cm-1, 3293–3251 cm-1, 3133–3081 cm-1, 1639–1623 cm-1, 1392–1346 cm-1, 962–941 cm-1) of FTIR-HTS spectra of fungi (pre-processed by 2nd derivative and EMSC) grown on (A) YE-Pi and (B) AS-Pi. In A and C, the score plot and the corresponding loading plot are shown for fungi grown on YE-Pi using different Pi levels. In B and D, the score plot and the corresponding loading plot are shown for fungi grown on AS-Pi media using different Pi levels. The color coding is according to the Pi levels. The loading plots show that the total chitin/chitosan content is increasing from the left to the right in both score plots. The explained variance for the first principal component is 79% and 80% for YE and AS, respectively.

