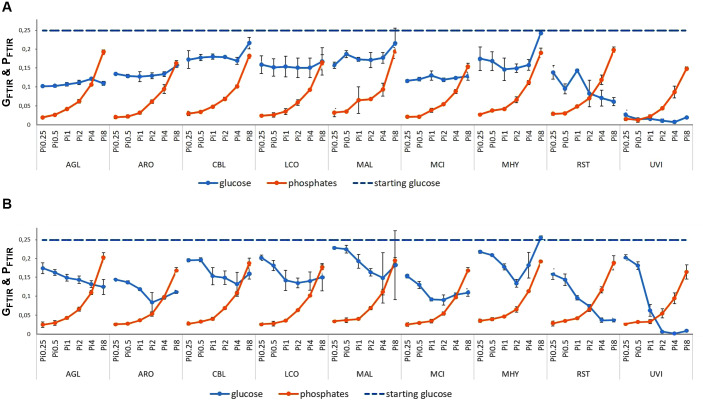
Fig 13. Estimation of the consumption of glucose and phosphate salts in the growth media after cultivation by FTIR-ATR.
Starting glucose concentration corresponds to the blue dashed line, final glucose concentration the blue full line and final phosphates concentration are pictured with the orange line. Figure A shows the Ye-Pi media and figure B AS-Pi media.

