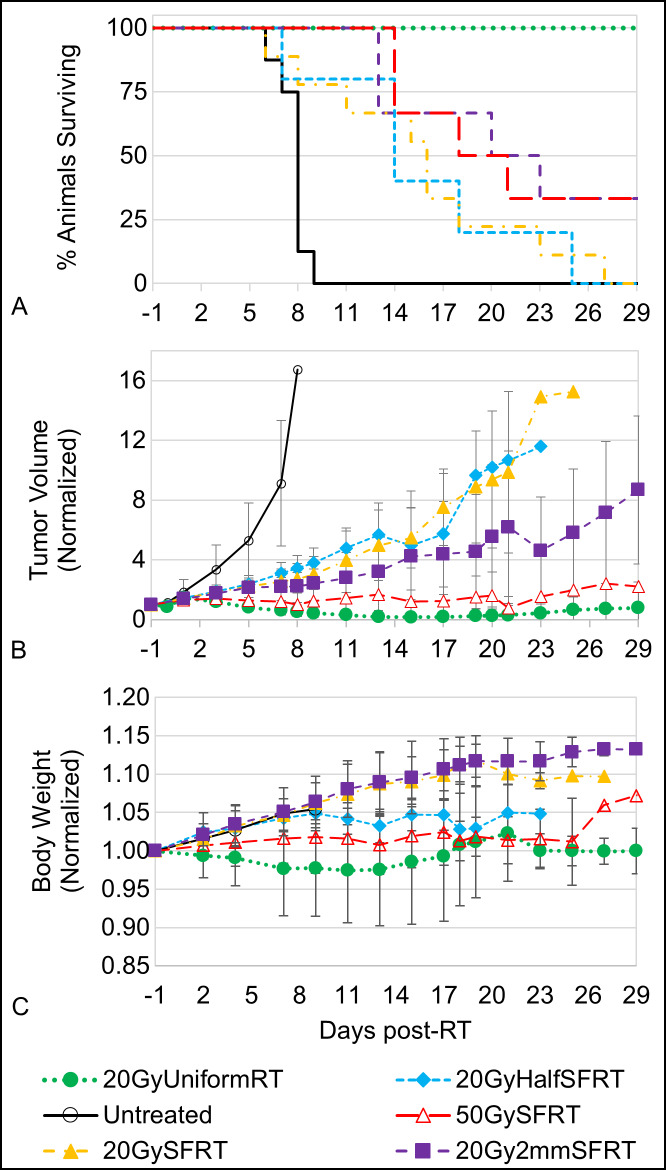
Fig 6. Animal survival, tumor volume change, and body weight change post-treatment.
Animal survival (A), normalized averaged tumor volume (B), and normalized averaged body weight (C) are shown for all six study arms. In plots (B) and (C), the error bars at each time point represent one standard deviation from the mean for each treatment arm. The statistical significance values for each pair of survival curves are shown in S2 Table.

