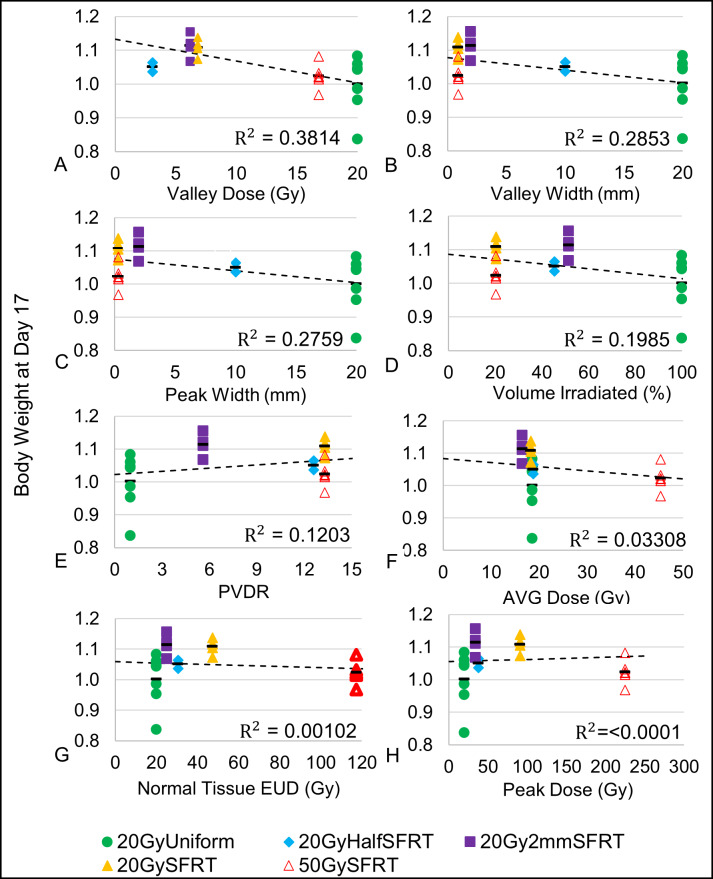
Fig 8. Associations between body weight change (Day 17) and eight dosimetric parameters.
Individual animal body weight change are plotted against each of the 8 treatment dosimetric parameters: valley dose (A), valley width (B), peak width (C), percentage volume irradiated (D), normal tissue EUD (E), PVDR (F), volume-averaged dose (G), and peak dose (H) vs % Body Weight at Day 17 and their corresponding regression lines and R2 values are shown. Eight linear regression models with single covariates, one for each dosimetric parameter, were used to calculate the R2 value and corresponding statistics. The body weight change averages for each of the treatment arms are also shown (black bars).

