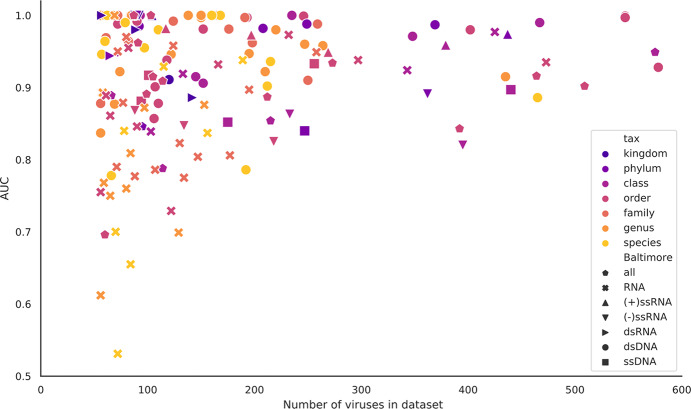
Fig 6. Comparison of the AUC scores against the size of the datasets.
The scatterplot shows that most of the classifiers achieve good AUC scores (above 0.85). This is the case even for the small datasets and for those at family level and below. The points are coloured by the host taxon level and shaped by Baltimore group. All the classifiers are for AA_4 feature sets. All AUC scores of less than 0.5 were reset to 0.5, i.e., no predictive signal.

