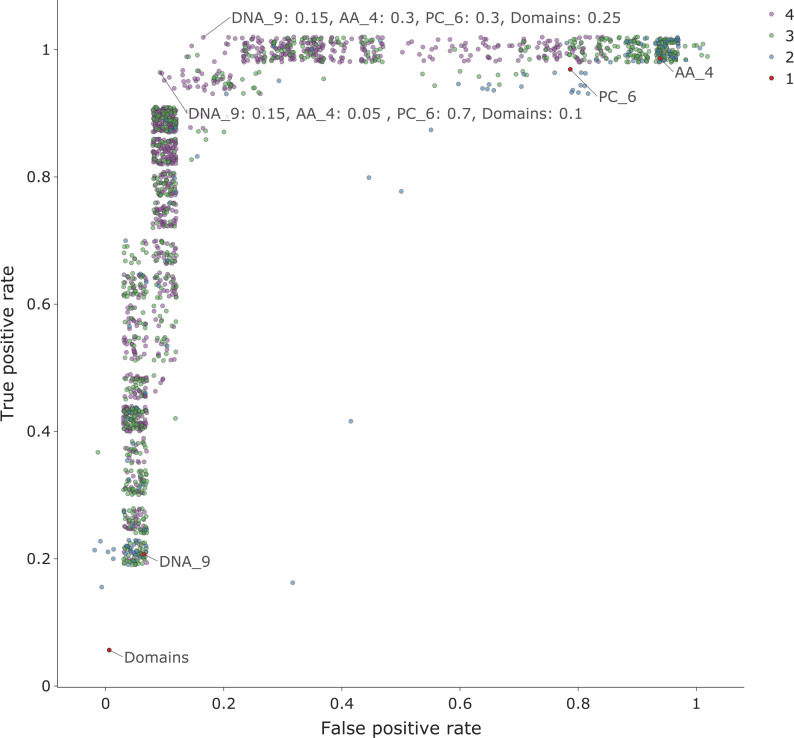
Fig 11. A plot of false positive rate (FPR) versus true positive rate (TPR) for the combined kernels of one dataset.
By adjusting the contribution of the different kernels, we can alter the specificity (1- FPR) and sensitivity (TPR) of the classifier. Each point represents the results for a classifier, each with a different combination of kernel weights, with the number of kernels shown by the point colour. The red (labelled) points are the results for the original single kernel classifiers. Additionally, two of the best classifiers have been labelled with the kernel contributions. This shows the results for all the iterations for combining kernels for the dataset for the host order Bacillales with holdout group Siphoviridae. The data points have been ‘jittered’ to reduce the overlap. The kernels used were: DNA_9—nucleotide sequence kmers length 9; AA _4—amino acid kmers of length 4; PC_6—physio-chemical properties of amino acid sequence kmers length 6; Domains—presence of PFAM domain in the sequence.

