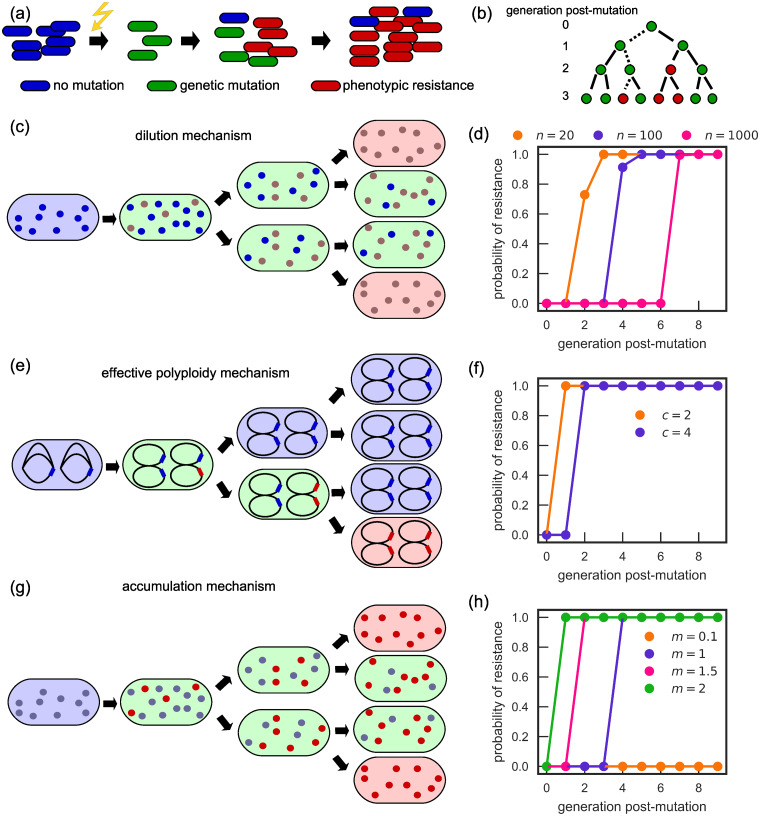
Fig 1. Models of phenotypic delay.
(a) Schematic representation of a simulated experiment, in which a mutagen (e.g., UV radiation) induces resistant mutations at a particular moment in time. Mutants initially remain sensitive to the antibiotic, only becoming resistant after a few generations. (b) Two ways of determining the time to resistance: tracking a single random lineage (dotted line), and tracking the whole population. In this example, resistance emerges in generations 3 and 2, respectively. (c) The dilution mechanism: blue/brown dots denote sensitive/resistant variants of the target molecule. When a wild-type cell (blue) mutates, it initially remains sensitive (green) and becomes resistant (red) when all sensitive molecules are diluted out. (d) Probability that at least one cell in an exponentially growing population starting with 100 newly genetically mutated cells is phenotypically resistant (dilution model) as a function of the number of generations since the genetic mutation (dots: simulation; lines: theory). Phenotypic delay increases with the number of molecules n to be diluted. (e) The effective polyploidy mechanism: chromosomes are represented as black ellipses, with a sensitive/resistant allele marked blue/red. (f) Same as in (d) but for the effective polyploidy mechanism. Phenotypic delay increases with ploidy c. (g) The accumulation mechanism: blue/red dots denote sensitive/resistant mutants of the resistant-enhancing molecule. Cells become resistant (red) when the cell contains enough resistant molecules. (h) Same as in (d) but for the accumulation model. Phenotypic delay decreases with increasing ratio m of the number of molecules produced during cell cycle and the number of molecules required for resistance.

