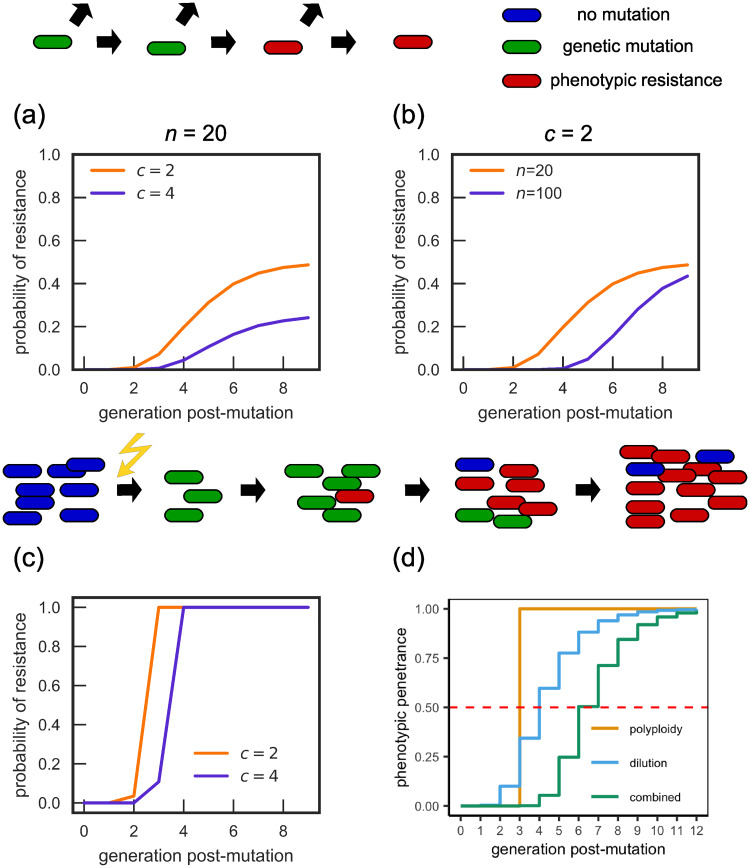
Fig 2. Combined effect of the dilution and effective polyploidy mechanisms.
(a-b) Probability of resistance of a single mutated cell. While the long-term probability is defined by the effective polyploidy, short-term behaviour is determined by the dilution mechanism, leading to longer phenotypic delays than the effective polyploidy mechanism would produce. (c) Population-level probability of resistance versus the number of generations from the mutation event, for n = 20. The combined mechanism leads to smoother curves than the effective polyploidy mechanism and longer delays than for either mechanism individually. (d) Phenotypic penetrance (ratio of phenotypically resistant to genetically resistant cells, obtained from Eq (1)) for the different mechanisms, for c = 8, n = 8. The dashed red line indicates when the phenotypic penetrance surpasses 1/2, which is the threshold used by Sun et al. [31] to define the emergence of phenotypic resistance. With this definition, the dilution mechanism plus effective polyploidy doubles the delay (generation 6 as opposed to generation 3 compared to effective polyploidy alone).

