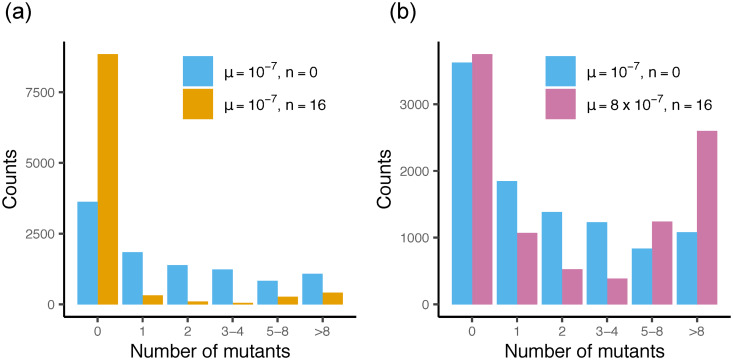
Fig 4. The dilution model affects the probability distribution of the number of resistant cells.
The frequency of mutants for a simulated fluctuation test with 10,000 samples, for the model with n = 0 (no delay) and n = 16. (a) Distributions for both models for a fixed μ = 10−7. (b) Distributions for the case when μ in the dilution model has been adjusted to minimize the difference to the no-delay model (values in the inset).

