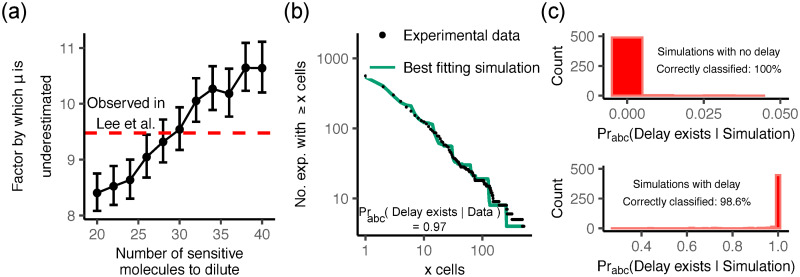
Fig 5. Phenotypic delay due to the dilution mechanism explains observed discrepancy in mutation rates and provides superior fit to fluctuation experiment data.
(a) We simulated the fluctuation experiment of Ref. [46], where the authors report a factor of 9.5 difference between the values of μ obtained by DNA sequencing and fluctuation tests. For each n we simulated 1000 experiments with the sequencing-derived mutation probability μ = 3.98 × 10⁻⁹ and then used the same estimation procedure as Ref. [46] to infer μ assuming no delay exists. n = 30 sensitive molecules are required to account for the discrepancy observed. Error bars are 1.96 × standard error. (b) The experimental cumulative mutant frequency distribution reported by Boe et al. [47] (black points) and the best-fit simulated distribution (green line) for the dilution phenotypic delay model. The staircase-like shape of the simulated distribution is caused by the fixed division time and strictly synchronous division of the mutated cells. (c) Histograms of the probability of the delay model obtained by applying the approximate Bayesian computation scheme to simulated data. Our classification algorithm correctly discriminates between the models.

