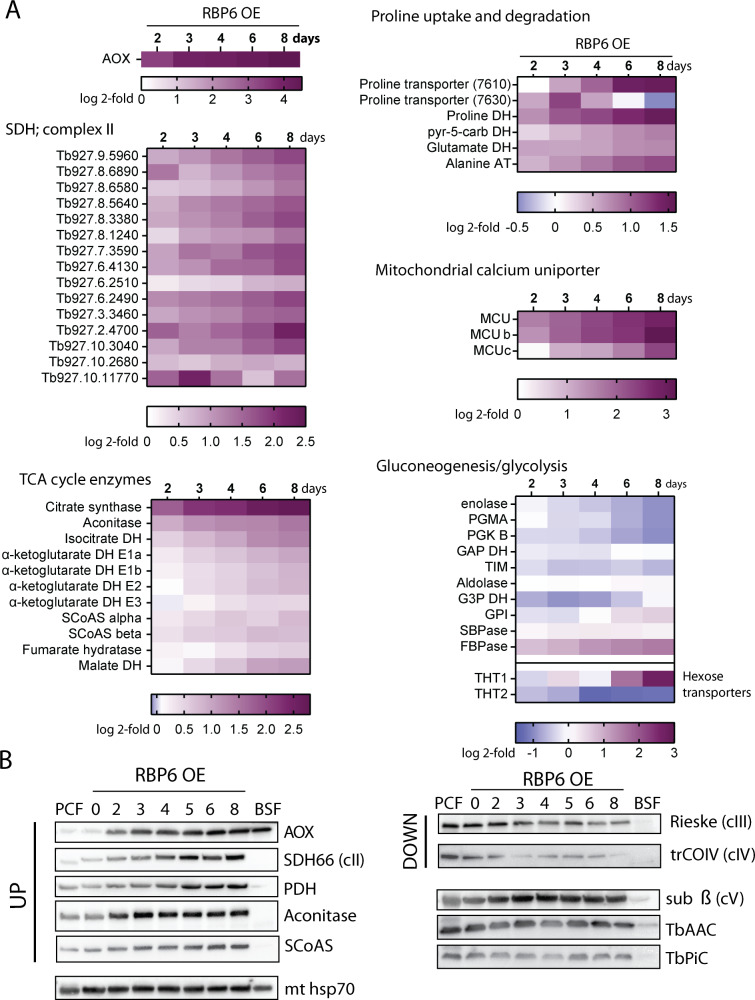
Fig 3. Major changes in protein abundance during RBP6 overexpression.
(A) Heatmaps showing log2 fold change of average LFQ intensities of selected proteins identified in induced samples compared to uninduced. The color key differs for each map and is always located below the heatmap. (B) Western blot analyses of whole-cell lysates from RBP6OE cells undergoing differentiation using a panel of various antibodies. Mitochondrial (mt) hsp70 serves as a loading control because its expression remains constant. AOX, alternative oxidase; AT, aminotransferase; BSF, bloodstream form; DH, dehydrogenase; FBPase, fructose 1,6-bisphosphatase; GAP DH, glyceraldehyde-3-phosphate dehydrogenase; G3P DH, glycerol-3-phosphate dehydrogenase; hsp70, heat shock protein 70; LFQ, label-free quantification; PCF, procyclic form; PDH, pyruvate dehydrogenase; PGK, phosphoglycerate kinase; PGMA, phosphoglycerate mutase; pyr-5-carb DH, pyrroline-5 carboxylate dehydrogenase; RBP6, RNA binding protein 6; SBPase, sedoheptulose 1,7-bisphosphatase; SCoAS, succinyl CoA synthetase; SDH, succinate dehydrogenase; TIM, triose-phosphate isomerase.

