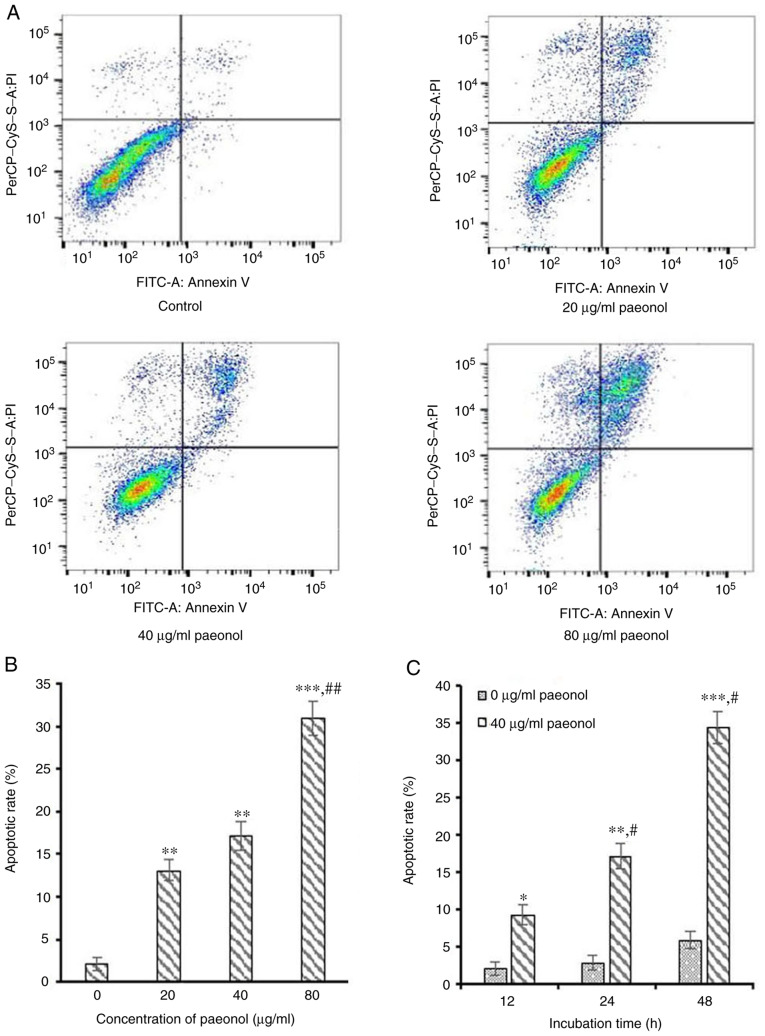
Figure 3.
Effect of paeonol on the apoptotic rate in HCT116 cells. (A) After incubation with different doses of paeonol for 24 h, the apoptotic rate was measured using flow cytometry. (B) Histogram of apoptotic cells following exposure to different doses of paeonol for 24 h. (C) Histogram of apoptotic cells following exposure to 40 µg/ml paeonol for 12, 24 and 48 h. *P<0.05, **P<0.01 and ***P<0.001 vs. control group (0 µg/ml); #P<0.05 vs. the group at the time point of 12 h; and ##P<0.01 vs. 20 and 40 µg/ml paeonol groups or the groups at the time point of 12 and 24 h. PI, propidium iodide.

