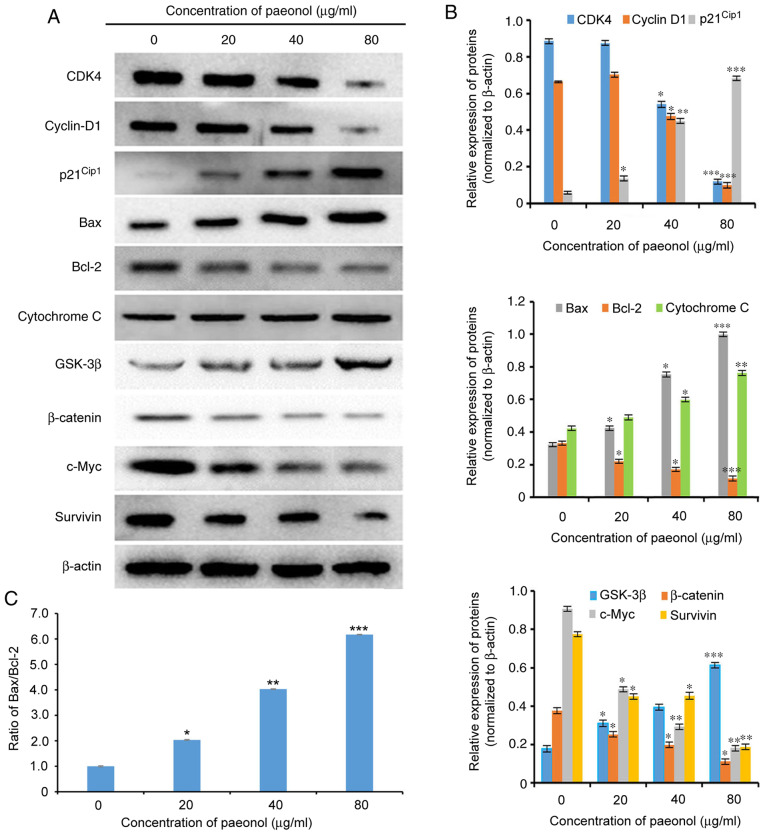
Figure 6.
Effect of paeonol on the protein expression in HCT116 cells. (A) After incubation with different doses of paeonol for 48 h, the protein expression was detected by western blot analysis. (B) Quantification of cell cycle-coordinating proteins, apoptotic-associated proteins and GSK-3β, β-catenin, c-Myc and survivin proteins following exposure to different doses of paeonol for 48 h. (C) Ratio of Bax/Bcl-2. *P<0.05, **P<0.01 and ***P<0.001 vs. control group (0 µg/ml). GSK, glycogen synthase kinase; CDK, cyclin-dependent kinase.

