Figure 3.
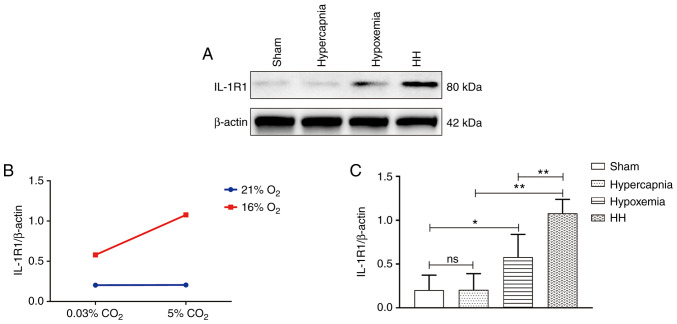
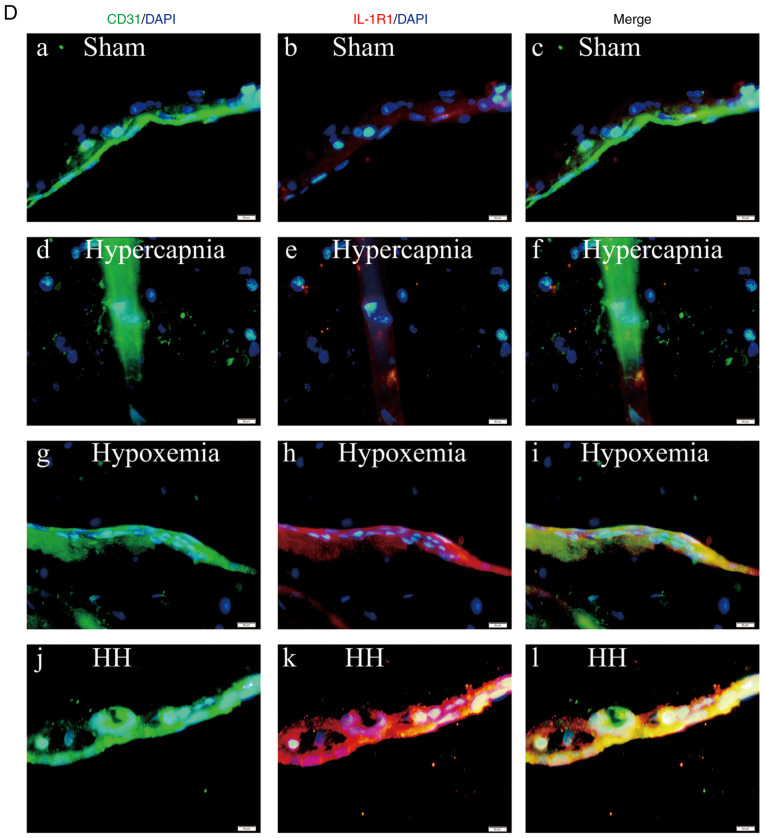
Hypercapnia increased IL-1R1 expression in the cerebrovascular endothelial cells of hypoxemic rats (n=4). (A) Immunoreactive bands of IL-1R1 (80 kDa) and β-actin (42 kDa). (B) There was an interaction effect between hypoxia treatment and hypercapnia treatment (P<0.05). (C) Simple effects analyses revealed increased IL-1R1 expression in the hypoxemia group (*P<0.05), but not in the hypercapnia group (P>0.05) compared with the Sham group. The HH group exhibited the highest expression levels of IL-1R1 when compared with the hypoxemia group (**P<0.01) and the hypercapnia group (**P<0.01). (D) Immunofluorescence images showing the expression of CD31+ cerebrovascular endothelial cells (a, d, g and j, green), IL-1R1 (b, e, h and k, red), and the co‑localization of IL‑1R1 and cerebrovascular endothelial cells (c, f, i and l). Of note, enhanced IL‑1R1 immunofluorescence was evident in the hypoxemia group, but not in the hypercapnia group, compared with the Sham group. The HH group emitted the strongest IL‑1R1 fluorescence as compared with the hypoxemia and hypercapnia groups. Scale bars (a-l): 50 μm. The concentrations of O2 and CO2 in the air were 21 and 0.03%, respectively. IL-1R, interleukin-1 receptor; HH, hypercapnia + hypoxemia; ns, non‑significant.


