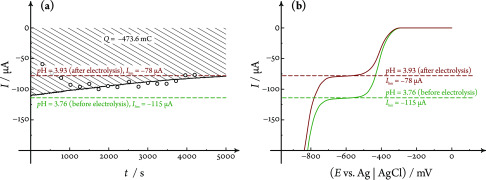
Figure 5.
Results of long-term electrolysis (hydrogen evolution from a HClO4/NaClO4 electrolyte solution) measured by iRDE&GC. Currents measured electrochemically (full black curve) and chromatographically (calculated using eq 1, dots) at E = −625 mV vs Ag|AgCl are shown in (a). A slow drift (decay) over time can be observed as a result of the electrolysis becoming exhaustive. Values of pH measured before and after the electrolysis, along with limiting currents estimated using the respective H+ concentrations and the diffusion coefficient of 8.79 × 10⁻⁵ cm2 s–1 are shown by the dashed horizontal lines. This pH change is in alignment with the shifting of the LSV plateaus shown in (b) and also corresponds to the estimated H+ concentration change calculated by taking into account the charge of the electrolysis, shown as the hatched area in (a), and a cell volume of 87 cm3. The applied rotational rate was 1600 min–1, and the linear sweep voltammograms were recorded at a sweep rate of 50 mV s–1.

