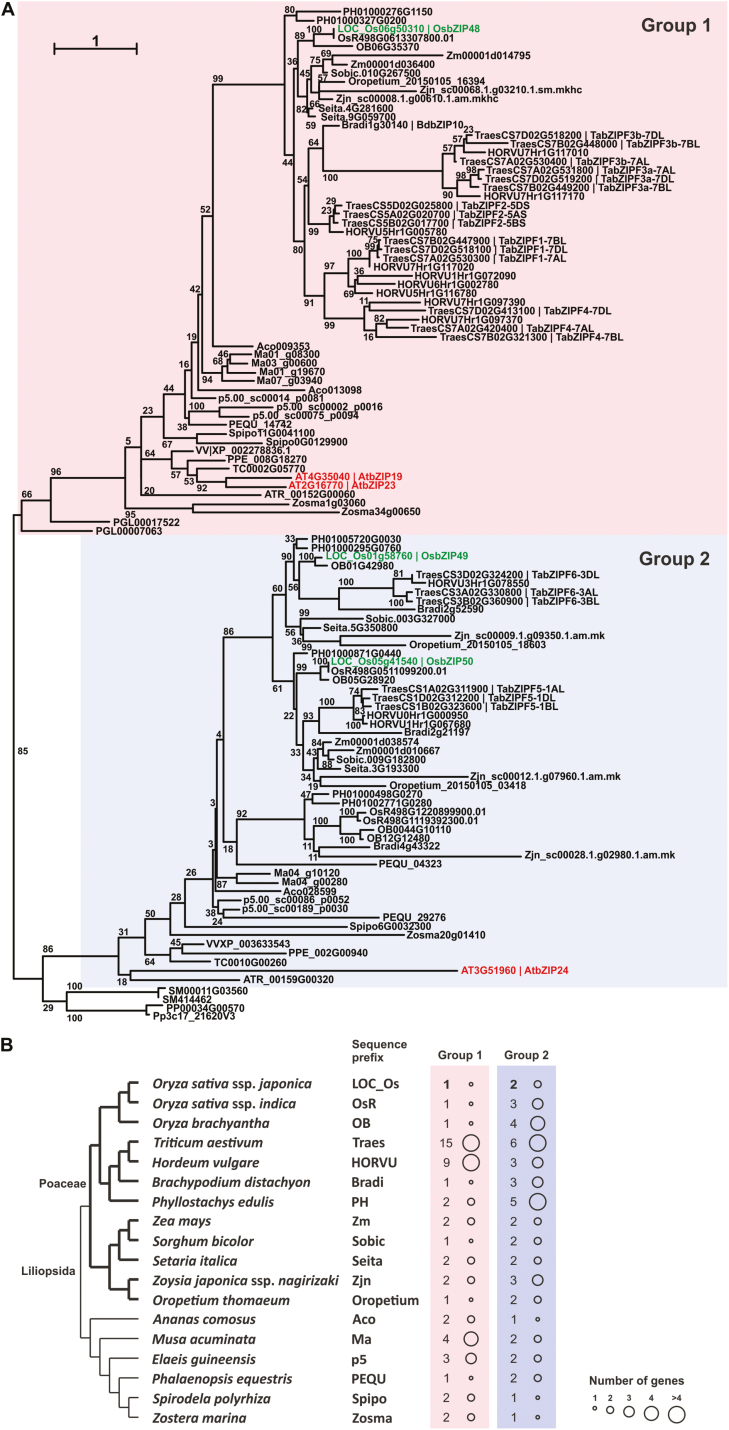
Fig. 2.
Phylogenetic analysis of the F-bZIP proteins in monocot plant species. (A) Phylogenetic tree representing 17 monocot species, the major taxa within monocots, plus representative species from other major plant taxa. The tree was constructed using maximum likehood and bootstrap values from 1000 replicates. Numbers on each branch represent the bootstrap percentages. (B) F-bZIP gene enrichment for each monocot plant species. Circle size represents the absolute number of expected genes present in the genome of each species.

