Fig. 3.

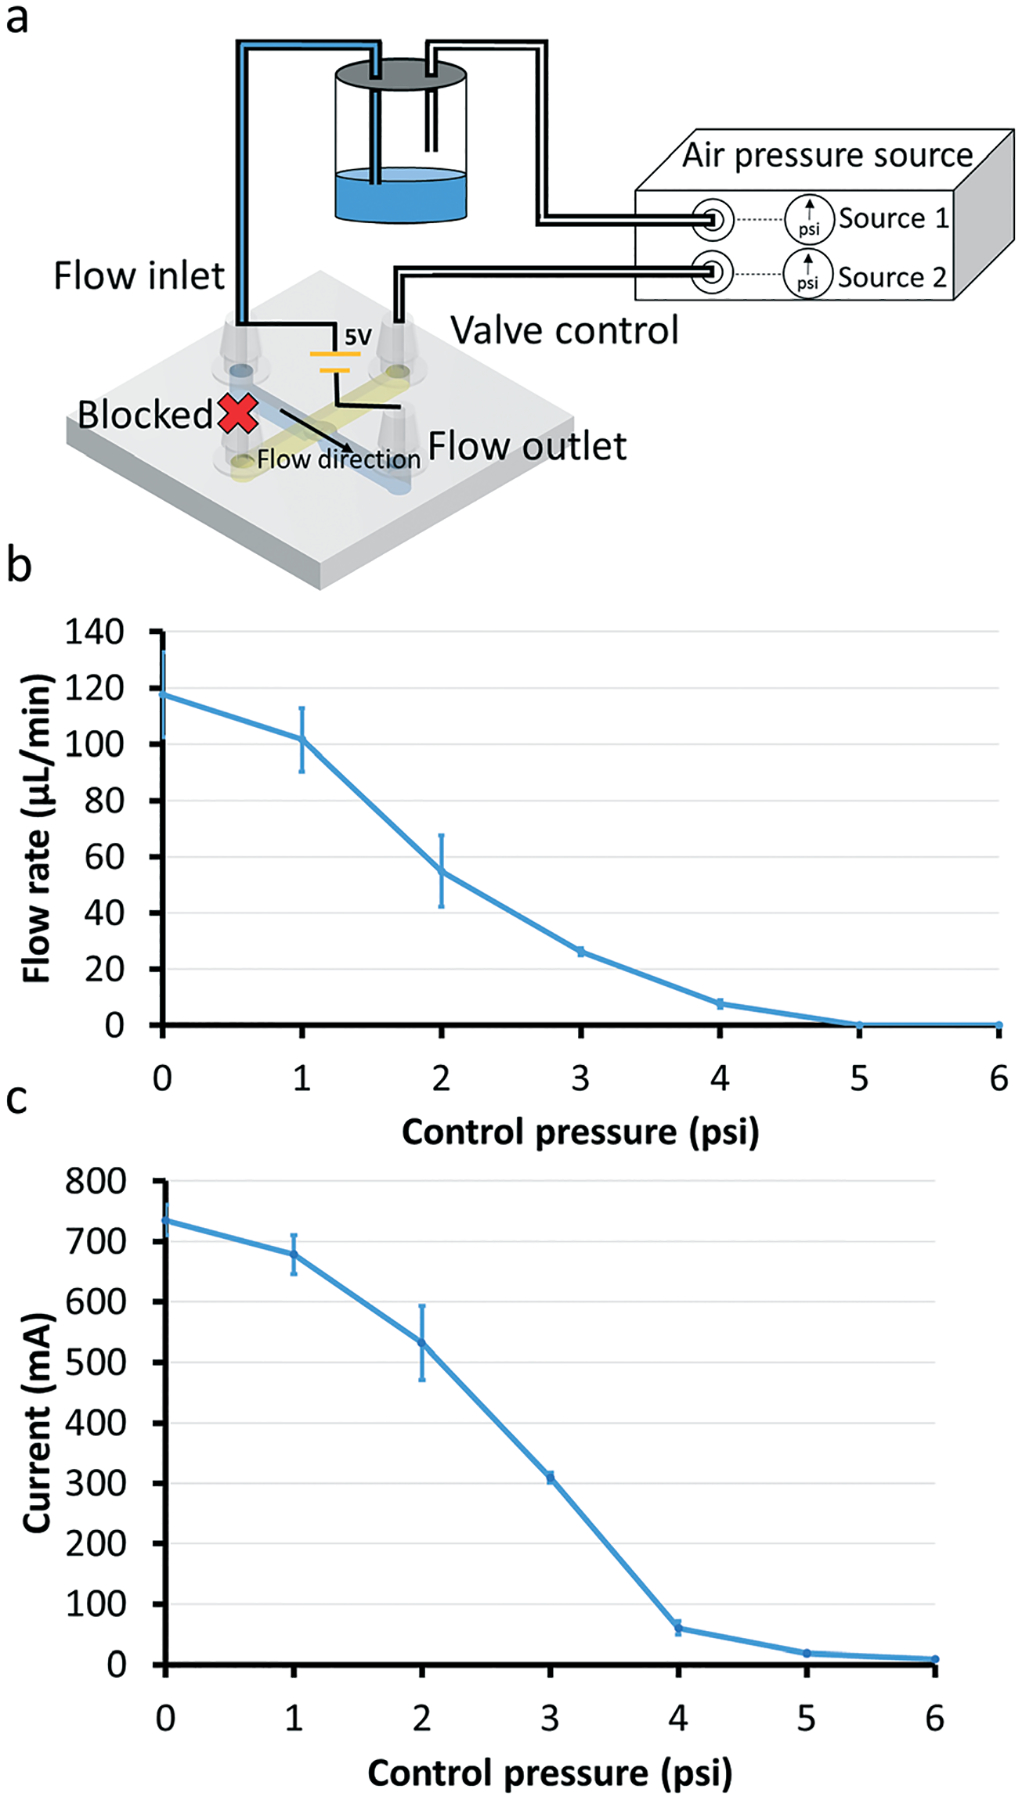
Flow rate measurements with 1200 μm-diam. valves. (a) Device setup for flow rate experiments. We used a digital pressure source (Elveflow OB1 MK3 system) to control the pressure applied to the control channel. One of the digital pressure outputs is connected to a liquid bottle in order to siphon the fluid out of the bottle and into the flow channel (shown as blue in the valve’s schematic diagram). The end of the control channel that is not connected to the bottle is kept blocked. Flow rates vary when different pressures are applied to the control channel. (b) Graph of the flow rate as a function of pressure applied to the Quake-style valve through the control channel. The pressure driving the flow is 0.2 psi for all data points (n = 3). Note that the fluid in the flow channel can be fully stopped when the applied pressure is above 5 psi. The error bars represent standard error of the mean. (c) Graph of the current through the flow channel as a function of the control pressures applied to the valve. A voltage of 5 V is applied to the flow channel filled with a saline solution (0.1 M KCl). The current detection setup is shown in Fig. 4a. As the control pressure increases, the current detected by the oscilloscope decreases. The current is ~4 mA when the applied pressure in the control channel is 6 psi. The pressure driving the flow is 0.2 psi for all data points (n = 3). The error bars represent standard error of the mean.
