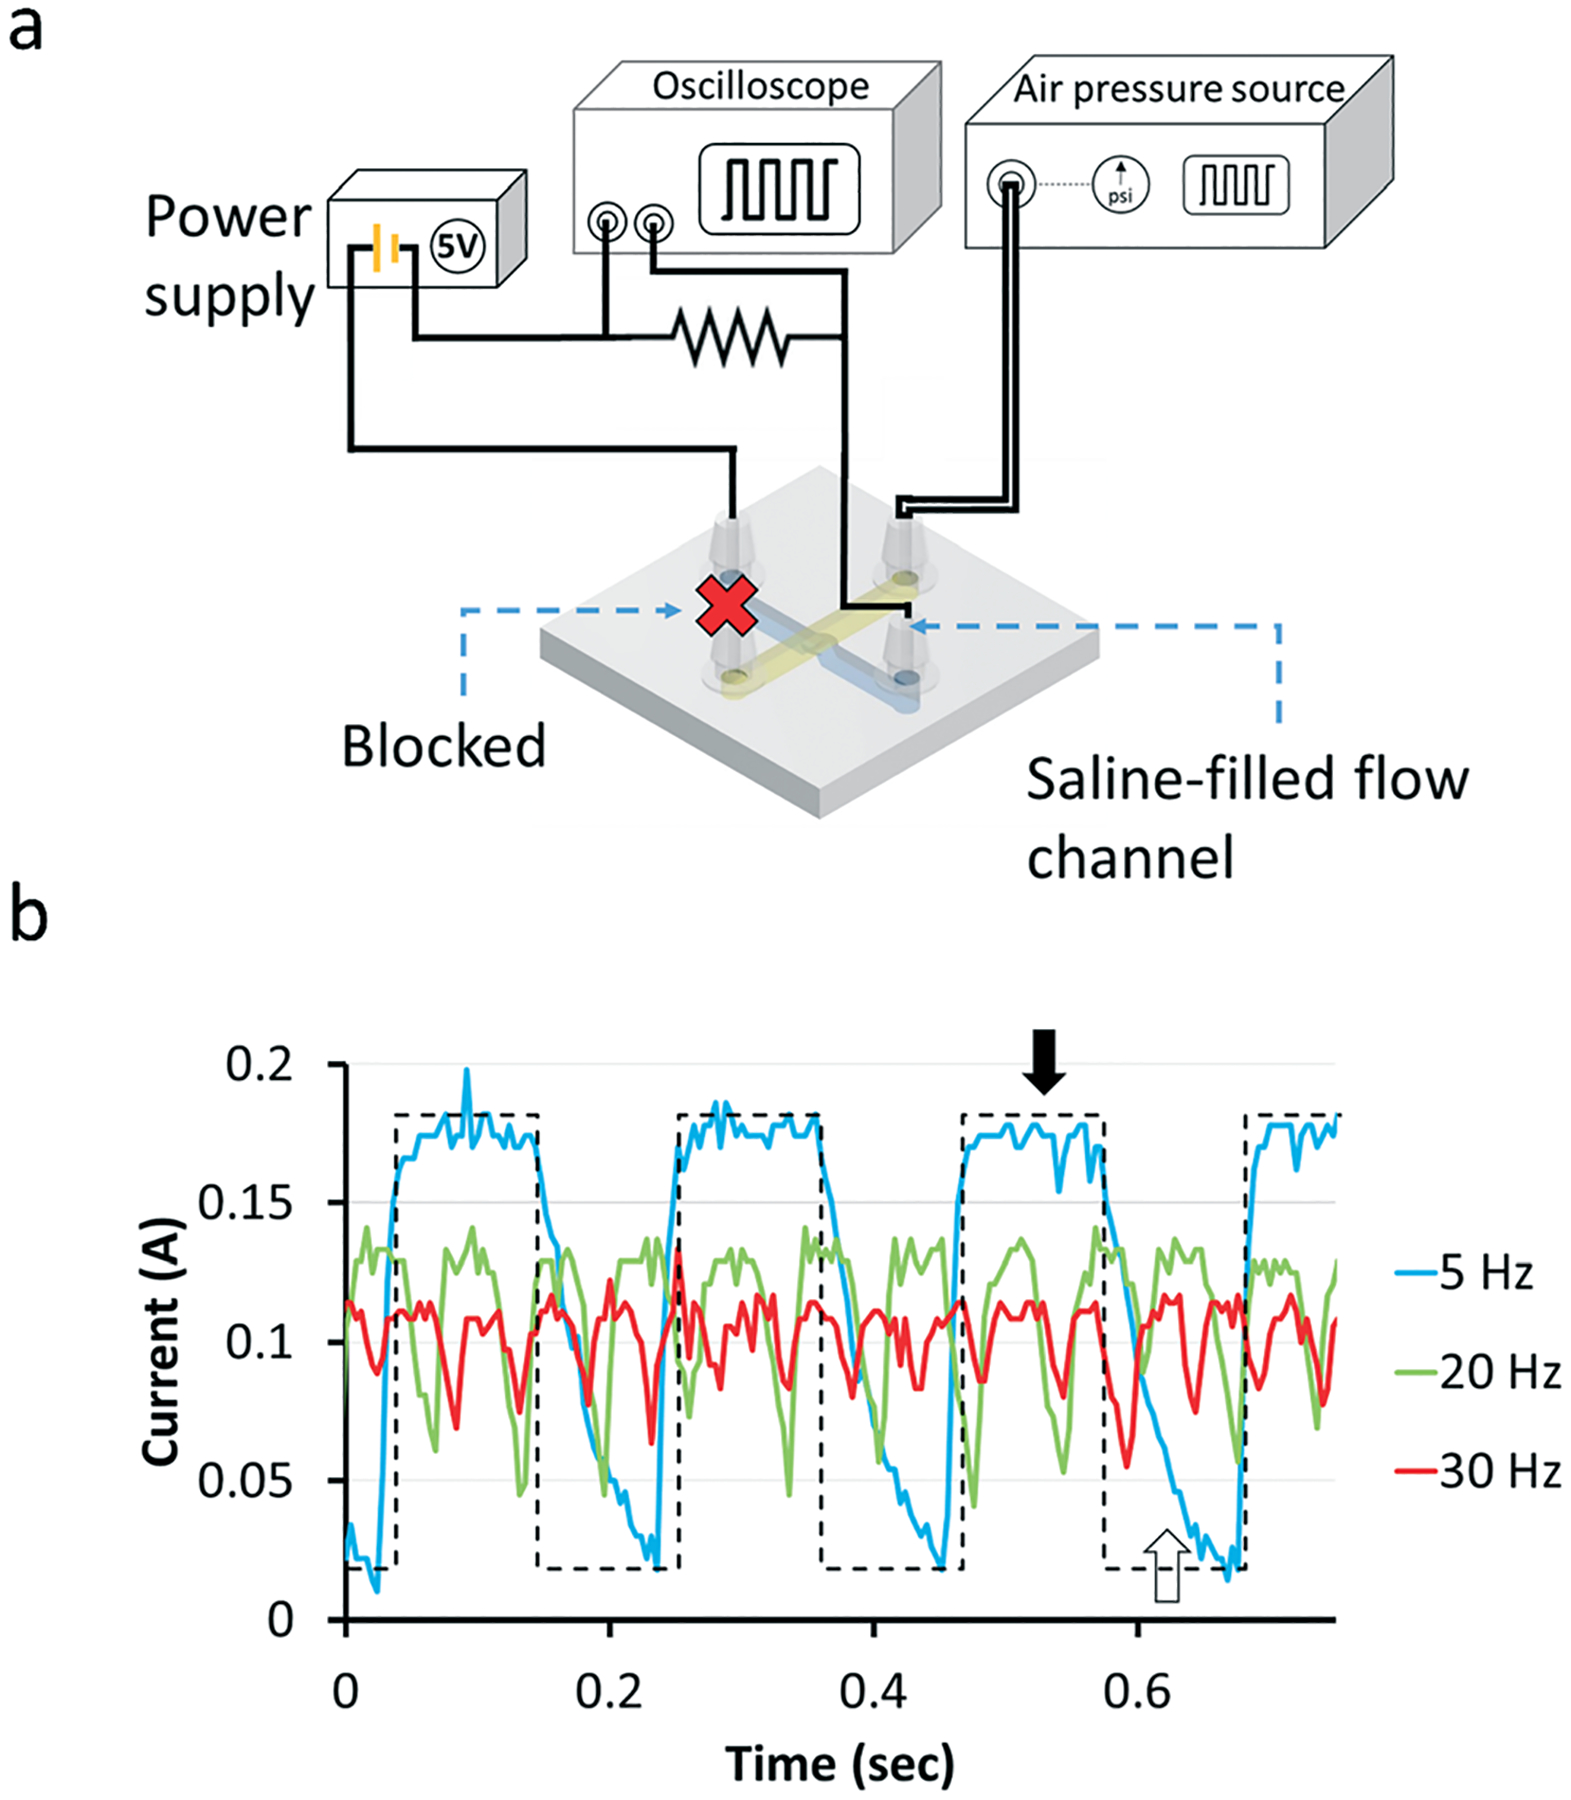
Fig. 4.

Measurement of valve dynamics with a 1200 μm-diam. valve. (a) The flow channel is filled with 0.1 M KCl solution. The inlet and outlet of the flow channel (colored with blue) are connected to an electric circuit, one end of the flow channel is connected to the power supply and the other end is connected to an oscilloscope. The voltage of the power supply is set to 5 V. A pressure of 5 psi is applied to the control channel (colored with yellow). (b) Voltage changes during the valve opening and closing states at three valve actuation frequencies (5, 20 and 30 Hz). The black and white arrows show the fully open and fully closed states, respectively. The dashed line shows the ideal current change at 5 Hz assuming the valve responds infinitely fast to the pressure changes.
