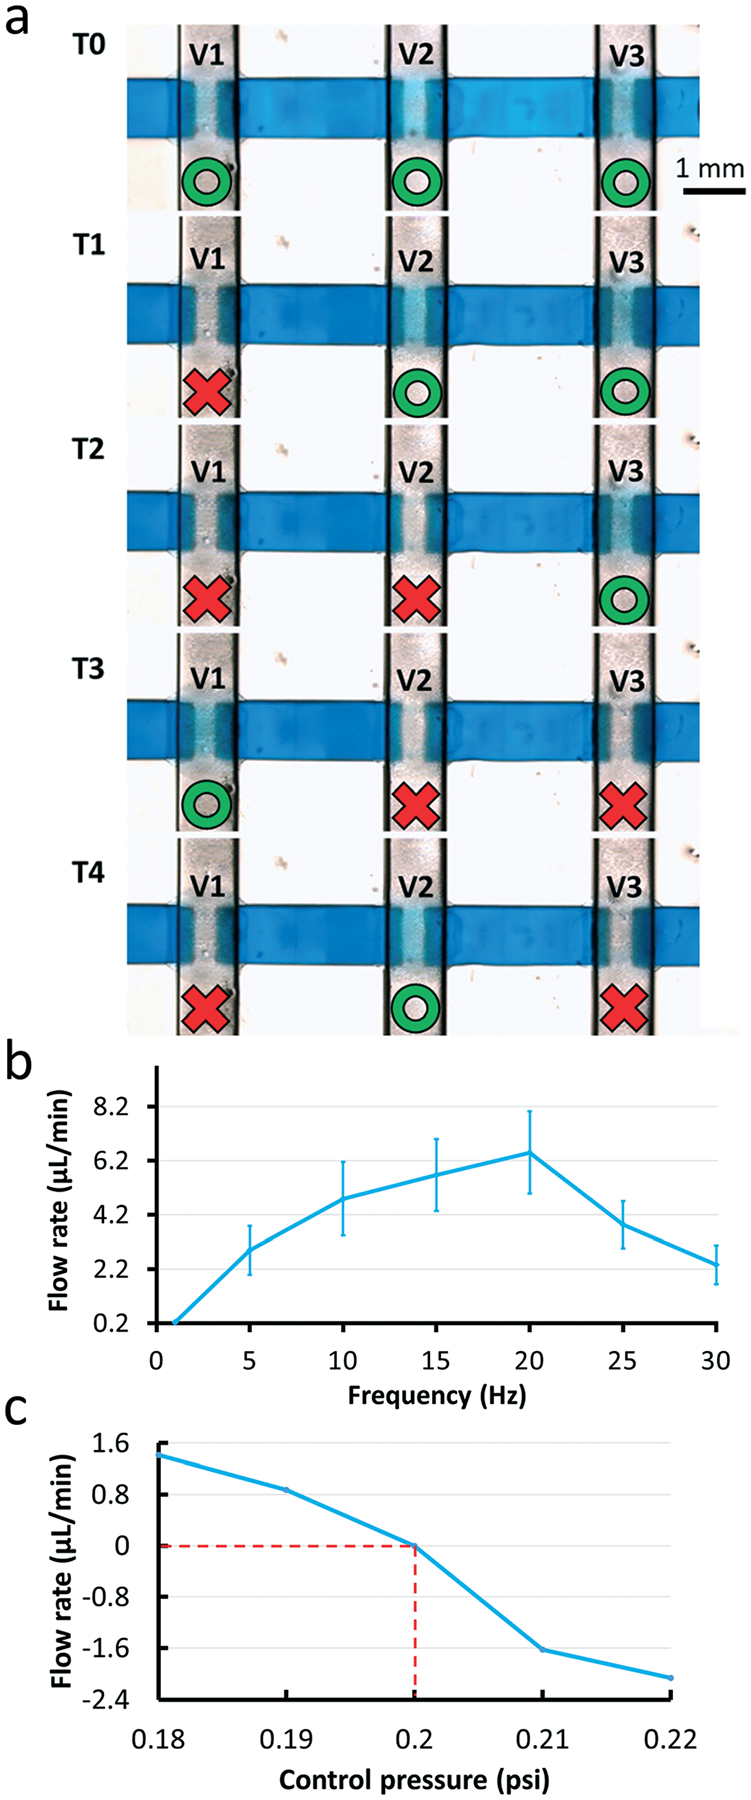
Fig. 6.

(a) The valve actuation sequence used to control a Quake-style pump with 1200 μm-diam. valves. In the first state (T0), all valves are open. The states denoted from T0 to T4 show each state of the 5-phase actuation. Each valve n (Vn) is closed in the Tn state and in the Tn+1 state. After finishing the first round, from T0 to T4 states, the valve closing cycle repeats between the T2 state and T4 state; the red color represents the state of valve closed state and the green represents the valve open state. (b) Graph of the relationship between pump rates and pump actuation frequencies. The valve closing pressure is fixed at 7 psi. The pump has the highest flow rate when the pump actuation frequency is 20 Hz. Experiments were conducted in triplicate. (c) Graph of pumping flow rates versus the head pressure that the 3D-printed Quake-style pump can work against when the control pressure is 14 psi with 20 Hz pump actuation frequency. When a pressure of 0.2 psi is applied at the outlet of the flow channel, the fluid stalls. The fluid moves forward (positive flow rates) when the head pressure is less than 0.2 psi and backward (negative flow rates) when the head pressure is greater than 0.2 psi.
