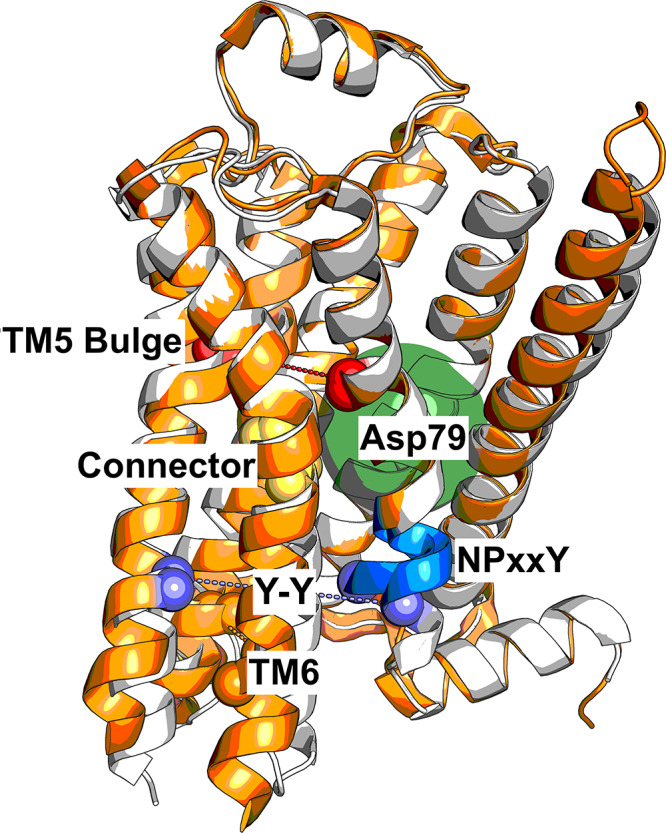
Figure 1.

Activation mechanism of GPCRs involving a series of microswitches. Binding of the agonist BI-167107 leads to an inward bulge of TM5 (quantified as the distance between Ser2075.46 and Gly3157.41, red spheres), which leads to a conformational change in the connector region (Ile1213.40 and Phe2826.44, yellow spheres). The transmembrane cavity surrounding Asp792.50 is dehydrated (filled green circle), and the NPxxY motif (blue cartoon) twists upon activation, leading to the Y–Y interaction (Tyr3267.53 and Tyr2195.58, purple spheres). TM6 moves outward to create the G protein binding site. The inactive (PDB entry 2RH1(5)) and active (PDB entry 3P0G(6)) structures are colored white and orange, respectively.
