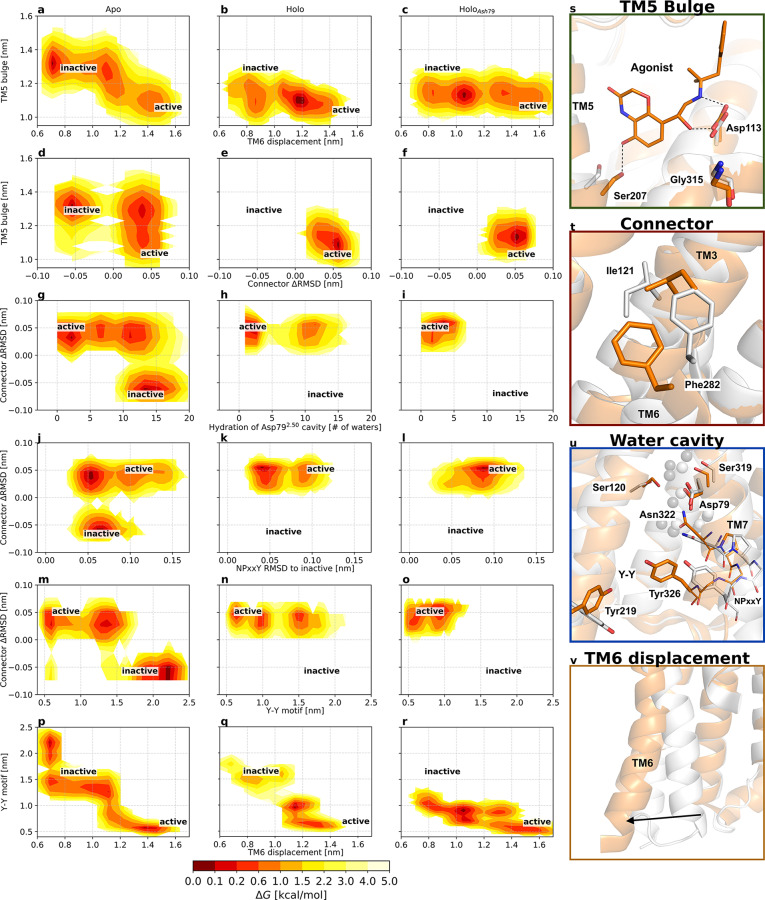
Figure 4.
Free energy landscapes projected along variables of interest highlight changes in the pairwise coupling of microswitches following binding of an agonist ligand (middle column) and protonation of conserved residue Asp792.50 (right column). The free energy landscapes are projected along (a–c) the TM5 bulge (distance between Ser2075.46 and Gly3157.41, representing the ligand binding site contraction) and the distance between Leu2726.34 and Arg1313.50, representing the outward movement of TM6; (d–f) the TM5 bulge (distance between Ser2075.46 and Gly3157.41) and the difference between the RMSD of Ile1213.40 and Phe2826.44 heavy atoms to the active and inactive crystal structures,5,6 representing the connector region ΔRMSD; (g–i) the connector region ΔRMSD and the number of water molecules within 0.8 nm of Asp792.50, representing the hydration of the Asp792.50 cavity; (j–l) the connector region ΔRMSD and the RMSD of the NPxxY motif relative to the inactive structure 2RH1; (m–o) the connector region ΔRMSD and the distance between the two tyrosines implicated in the Y–Y interaction (Y–Y motif), and (p–r) the Y–Y motif distance and the displacement of TM6. Active and inactive state regions are labeled for each variable pair. Low-free energy regions are colored red, and high-free energy regions light yellow. Free energies are reported in kilocalories per mole. See Table S2 for microswitch definitions. (s–v) Vignettes showing the conformation of the different microswitches in the active and inactive structures 3P0G (orange) and 2RH1 (white): (s) the TM5 bulge shifting Ser2075.46 inward, (t) the connector region containing Ile1213.40 and Phe2826.44, (u) the Asp792.50 cavity, NPxxY motif, and the two tyrosines, Tyr2195.58 and Tyr3267.53, of the Y–Y motif, and (v) the outward movement of TM6 upon activation.

