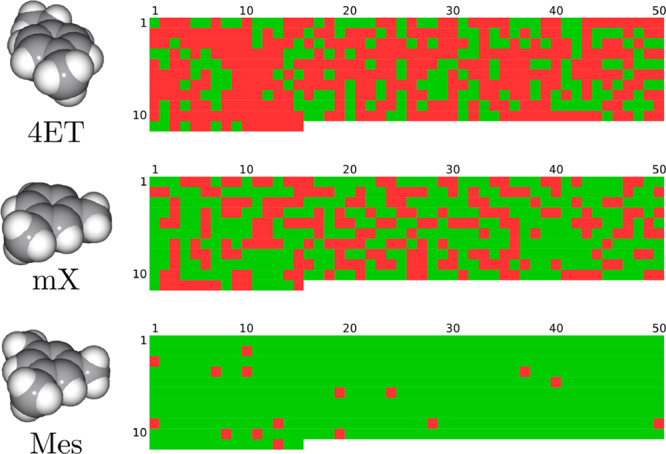
Figure 13.

Illustration of the caging prediction results. Each colored square corresponds to a single algorithm run with one of CC3 conformations. Color code: green, caging complex; red, not a caging complex. Conformations were obtained from a molecular dynamics trajectory (see the Supporting Information; the conformation index can be obtained with the following formula: i = row·50 + column – 50).
