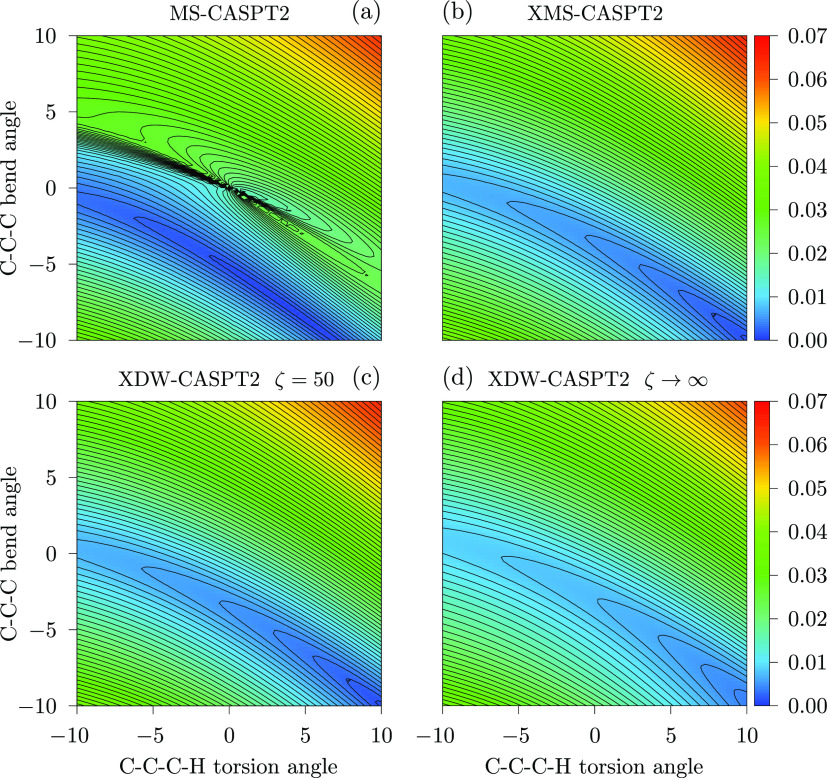
Figure 12.
Color-mapped isosurface plot of the absolute energy difference (in Eh) between the 11A′ and 21A′ states for a model space including 2 states. The same calculation was carried out with different methodologies: (a) MS-CASPT2, (b) XMS-CASPT2, (c) XDW-CASPT2 with ζ = 50, and (d) XDW-CASPT2 with ζ → ∞.

