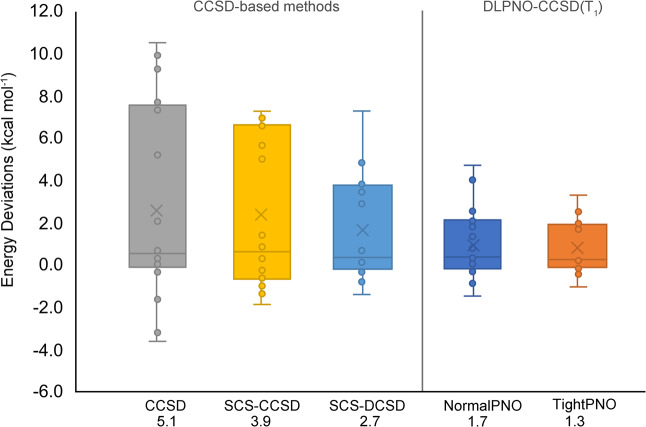
Figure 9.
Box-and-whisker plots for several CCSD-based methods and the DLPNO-CCSD(T1) approach (with different settings), showing the error spread for the expanded porphyrin database. The energy deviations are estimated with respect to canonical CCSD(T)/cc-pVDZ reference energies. The average RMSDs (in kcal mol–1) are also displayed below each method.

