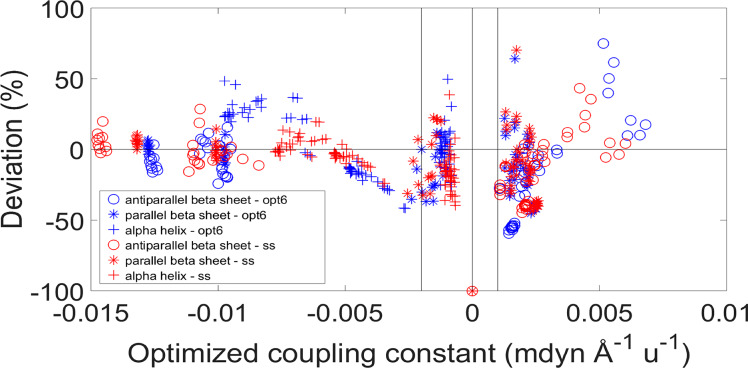
Figure 6.
Relative deviations between the coupling constants of TDC and DFT F matrices as a function of the TDC coupling constants, after applying the cutoff on the TDC coupling constants (between −0.002 and 0.001 mdyn Å–1 u–1) and on the angle between the transition dipole moments (lower than 30° and higher than 170°). See Figure 4 for the calculation of the relative deviations and significance of the vertical lines. The deviations are colored according to the type of optimization procedure: optimization on all structural models (“opt6”) is shown in blue, optimization by secondary structure (“ss”) in red.

