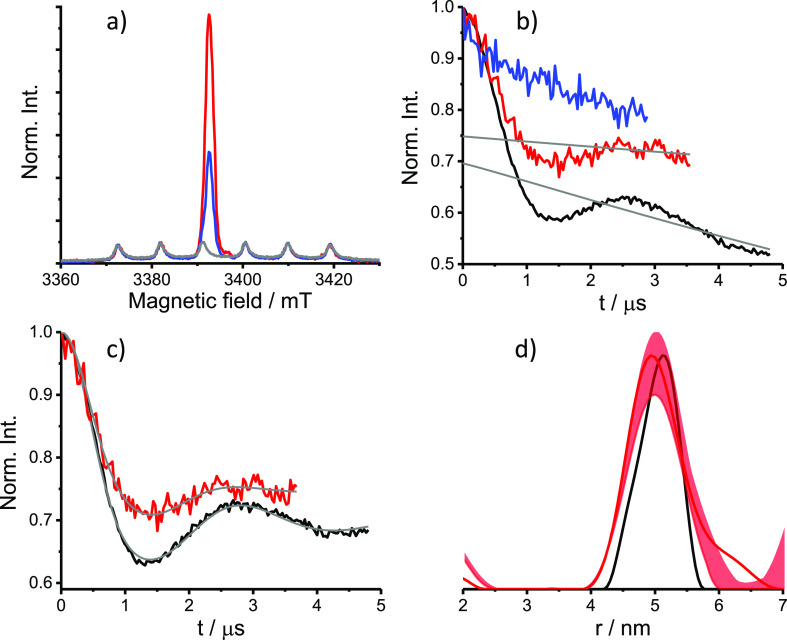
Figure 2.
DEER results for PpiB K25C/E153C-CT02MA. (a) W-band ED-EPR spectra of HeLa cells incubated 4 h (red) and 12 h (blue) after electroporation and of the control sample with 4 h incubation but without the electroporation step (gray). The ED-EPR traces were normalized to the intensity of endogenous Mn(II). (b) Primary DEER traces and background function (gray) of the 4 and 12 h in-cell sample (red and blue, respectively), compared with the solution sample (75 μM in D2O/glycerol-d8, black). (c) DEER traces shown in panel b after background removal and the fitting traces obtained with Tikhonov regularization using DeerAnalysis (gray).40 (d) Distance distributions. The uncertainty range obtained using a background decay validation of the in-cell sample is shown in light red.

