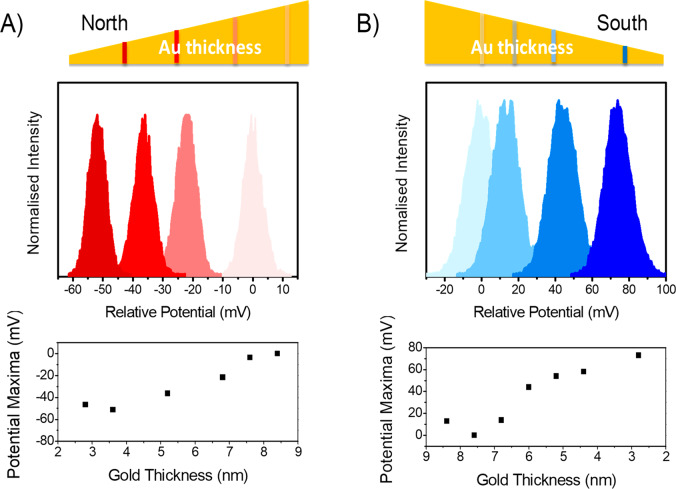
Figure 2.
Change in the CPD as a function of the Au layer thickness for the opposite Co magnetization directions with adsorbed l-AL5 SAMs. The top diagram shows the distribution of a potential in different regions of the magnetic sample along the Au wedge. The color of each plot corresponds to the region indicated on the gradient bar by the same shade. The zero voltage is set by the measurement at the region of the highest Au thickness of 10 nm. The maxima of the potential distribution curves versus the thickness of the gold layer are plotted at the bottom of the Figure. As shown in panel (A), the CPD becomes more negative as the gold thickness decreases for a north magnetization. In contrast, in panel (B) where the magnetization is south, the CPD becomes positive, and its value increases with decreasing gold layer thickness. To estimate the error in the measurements, see the full-width-at-half-maximum of the histograms.

