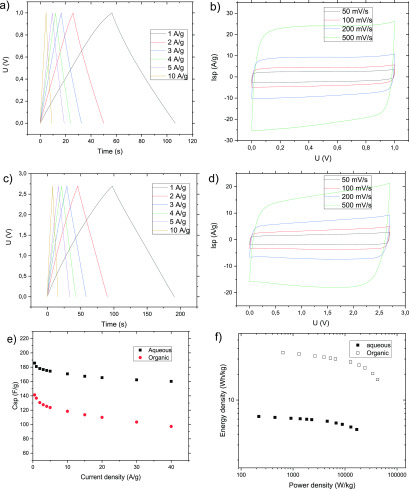
Figure 6.
Electrochemical performance of the coated a-rGO electrodes annealed at 200 °C and measured in a two-electrode configuration using (a and b) aqueous (6 M KOH) and (c and d) organic (TEA BF4/AN) electrolytes. (b and d) CV curves at varied scanning rates. (a and c) Galvanostatic charge–discharge curves at varied current density values. (e) Specific capacitance vs current density calculated using the galvanostatic discharge data. (f) Ragone plot.

