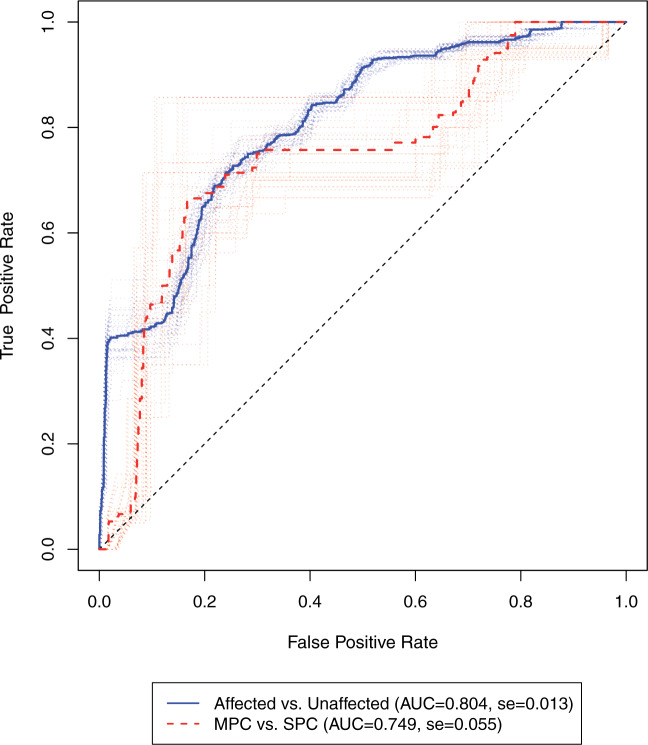
Fig. 3.
ROC of the 5-year risk of developing the second primary cancer in the LFS dataset. The dotted lines denote the ROC curves for 25 random splits of the data, each undergone a 10-fold cross-validation. The solid lines denote the median ROC curves. Affected vs. Unaffected, prediction of developing a cancer given that the individual has no history of cancer; MPC versus SPC, prediction of developing the next cancer given that the individual has had one primary cancer (SPC). Sample size: n(Affected) = 116, n(Unaffected) = 661, n(MPC) = 29, n(SPC) = 87. se, standard error.

