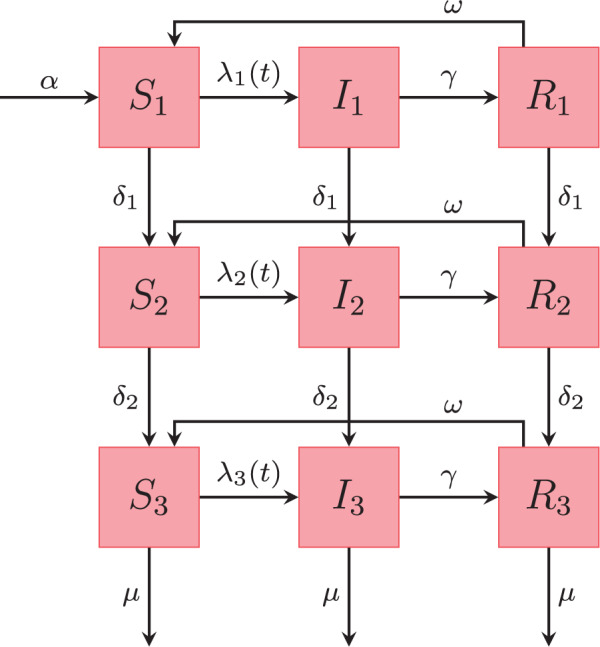
Fig. 2.

Schematic representation of the states in our SIRS model with three age classes. The rates on the arrows are explained in the text. Table 1 provides a list of notation, specifying which parameters are estimated in this work, and which are assumed known from the literature.
