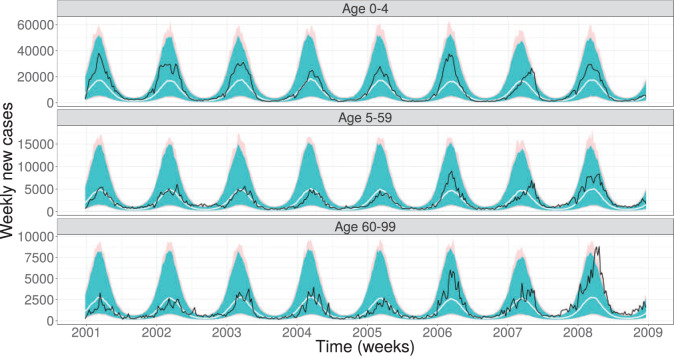
Fig. 3.
The 95% prediction interval (light shading) for 1000 realizations of Model St St
St evaluated at the maximum likelihood estimate for the rotavirus incidence data (solid back line) and the median (solid white line). Furthermore, the 95 % prediction interval of these 1000 realizations for only the transmission model is shown (darker shading).

