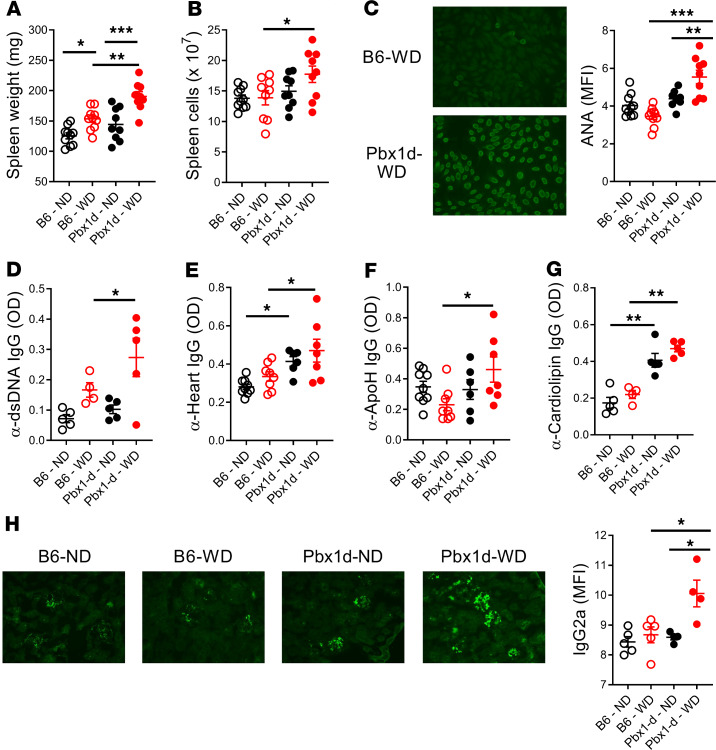
Figure 3. Pbx1d overexpression in CD4+ T cells enhances autoimmunity in Ldlr-KO mice fed with WD.
(A) Spleen weight and (B) total spleen cell numbers. (C–G) Serum autoantibodies at week 6 on ND or WD. Representative ANA staining and quantification of MFI (C) and anti-dsDNA (D), anti-heart (E), anti-ApoH (F), and anti-cardiolipin (G) IgG. (H) Representative IgG2a staining and MFI quantification in the kidneys of chimeric mice from each of the 4 groups. Means ± SEM compared with 1-way ANOVA with Tukey’s multiple-comparisons tests. *P < 0.05, **P < 0.01, ***P < 0.001. Each symbol represents 1 mouse. Original magnification, ×20 (C and H).

