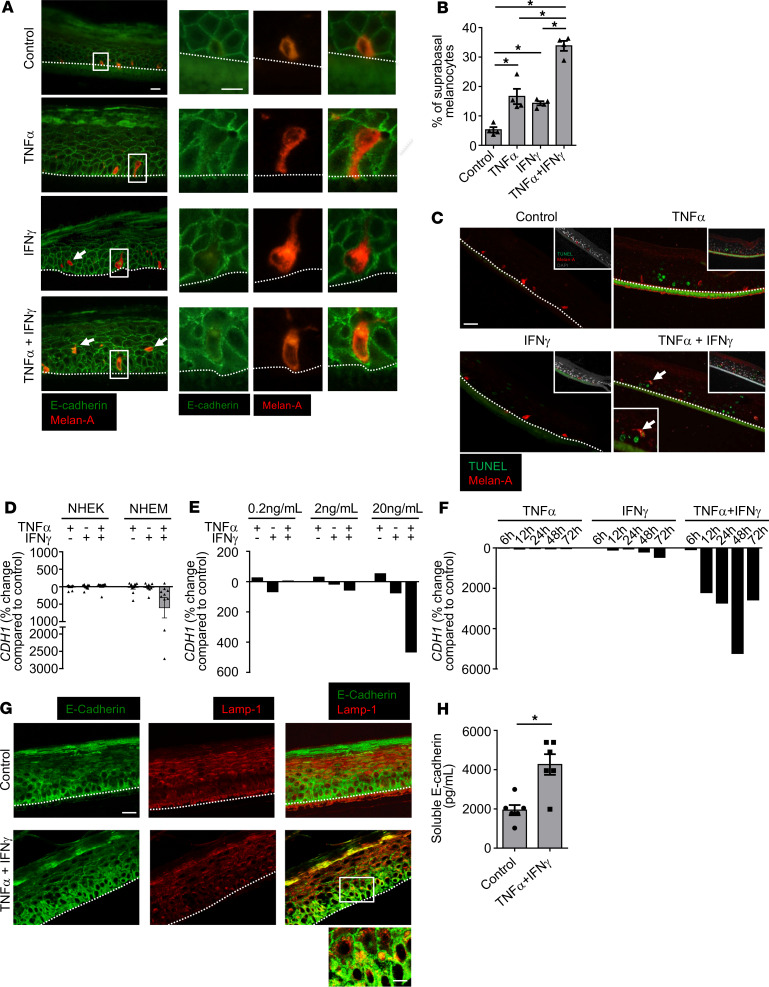
Figure 2. Combined activity of IFN-γ and TNF-α reproduces human vitiligo features in a 3D model of reconstructed pigmented epidermis in vitro.
(A–C) Reconstructed human pigmented epidermis (RHPE) containing melanocytes were stimulated for 24 hours in the presence or absence of 10 ng/mL of TNF-α and IFN-γ, alone or in combination. (A) Representative immunofluorescence analysis of Melan-A (red) and E-cadherin (green) expression. Alteration of E-cadherin expression around melanocytes. Dashed lines represent dermoepidermal layer. Scale bars: 20 μm (left), 10 μm (right). (B) Proportion of suprabasal melanocytes in the different conditions (n = 4). (C) Representative analysis of epidermal cell death using a TUNEL assay (green); melanocytes were stained with anti-Melan-A antibody (red). Dashed lines represent the dermoepidermal layer. Scale bar: 20 μm. Staining is representative of 3 independent experiments. (D) Primary cultures of normal human epidermal keratinocytes (NHEK, left, n = 10) or melanocytes (NHEM, right, n = 11) were treated for 24 hours with 20 ng/mL of IFN-γ and/or TNF-α. CDH1 gene expression in epidermal cells was analyzed by real-time PCR. Results are shown as the percentage of change compared with the control culture. (E) Dose-response study of CDH1 gene expression in NHEM after 24 hours stimulation with TNF-α and/or IFN-γ. (F) Kinetic analysis of CDH1 gene expression in NHEM in response to 20 ng/mL of TNF-α and/or IFN-γ. Results from 1 experiment are shown in E and F and are representative of 4 independent experiments with 4 independent donors. GAPDH was used as a housekeeping gene. (G) Confocal microscopy analysis of RHPE treated in the presence or absence of the combination of 10 ng/mL of TNF-α and IFN-γ for 24 hours. Sections were stained for E-cadherin (green) and LAMP-1 (a marker for lysosomes and late endosomes, red). Merge shows the presence of E-cadherin molecule into LAMP-1 vesicle structures. Scale bars: 20 μm (top); 10 μm (bottom). Stainings are representative of 3 independent experiments. (H) Assessment by ELISA of soluble E-cadherin levels in cell-free supernatants of RHPE treated for 24 hours in the presence or absence of 10 ng/mL of TNF-α and IFN-γ. Data in B, D, and H show mean ± SEM. *P < 0.05, **P < 0.01; calculated with 2-tailed Mann-Whitney (B) or Wilcoxon (H) tests.

