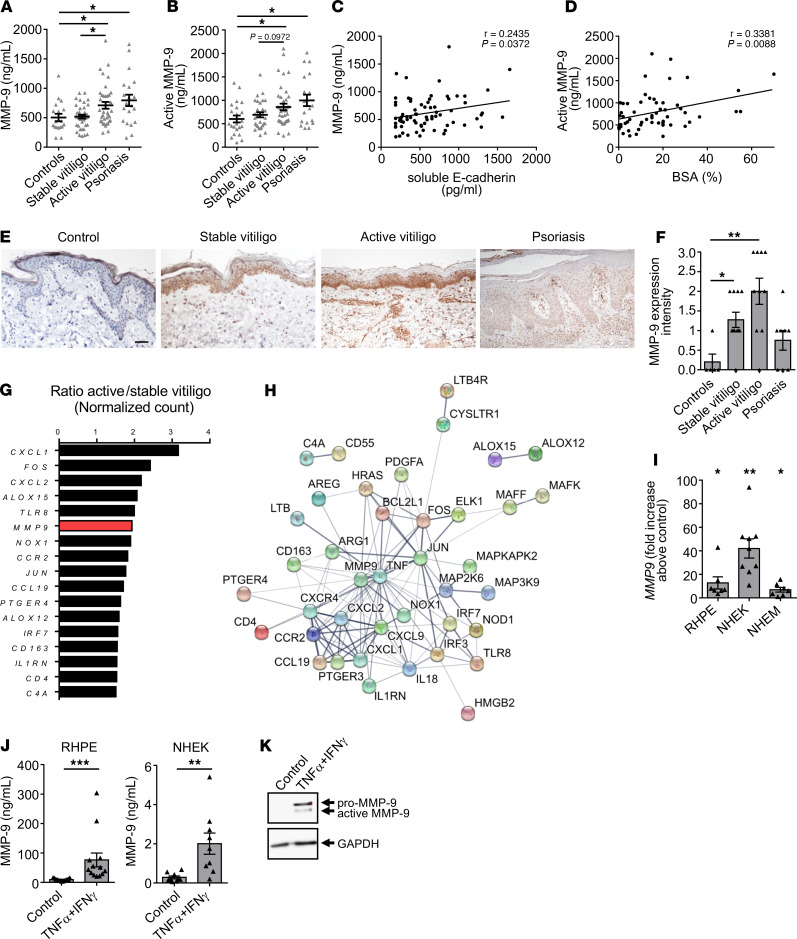
Figure 3. MMP-9 levels are increased in patients with vitiligo and correlate with soluble E-cadherin levels and surface of depigmentation.
(A) ELISA levels of MMP-9 in the sera of healthy controls (n = 18), patients with stable (n = 37) or active (n = 37) vitiligo, and patients with psoriasis (n = 20). (B) Active MMP-9 levels in the sera of healthy controls (n = 22), patients with stable (n = 30) or active (n = 39) vitiligo, and patients with psoriasis (n = 19). (C) Spearman’s rho correlation (2-tailed) between MMP-9 and soluble E-cadherin levels in the sera of patients with vitiligo (n = 73). (D) Spearman’s rho correlation (2-tailed) between serum active MMP-9 and body surface area (BSA) involved in patients with vitiligo (n = 59). (E) Representative IHC staining of MMP-9 expression in healthy control skin, perilesional skin of stable and active vitiligo, and lesional psoriatic skin. Scale bar: 100μm. (F) Semiquantitative analysis of MMP-9 expression in skin from healthy controls (n = 5), perilesional skin of vitiligo patients with stable (n = 11) or active (n = 10) disease, and lesional psoriatic skin (n = 8). (G and H) Inflammatory transcriptomic profile of perilesional skin of patients with stable (n = 3) and active (n = 6) vitiligo was assessed using NanoString technology. (G) The most upregulated genes are shown. Results show the change in gene expression between the 2 groups. (H) Predicted protein-protein interaction networks for upregulated genes using STRING online tool. The thickness of edges represents the strength of data support. The thicker the edge between 2 proteins, the more these proteins are linked based on the enrichment evidenced by STRING. (I and J) Reconstructed human pigmented epidermis (RHPE), NHEK, and NHEM were stimulated for 24 hours in the absence or presence of TNF-α and IFN-γ. (I) Real-time PCR analysis of MMP9 gene expression in RHPE (n = 7), NHEK (n = 9), and NHEM (n = 7). Data are shown as fold increase above the control culture. GAPDH was used as a housekeeping gene. (J) Levels of MMP-9 in cell-free culture supernatants of RHPE (n = 13, left) and NHEK (n = 9, right). (K) Western blot analysis of MMP-9 expression in NHEK treated for 24 hours in the presence or absence of 20 ng/mL of TNF-α and IFN-γ. Data in A, B, F, I, and J show mean ± SEM. *P < 0.05, **P < 0.01, ***P < 0.001; calculated with Kruskal-Wallis (A, B, and F) or Wilcoxon tests (I and J).

