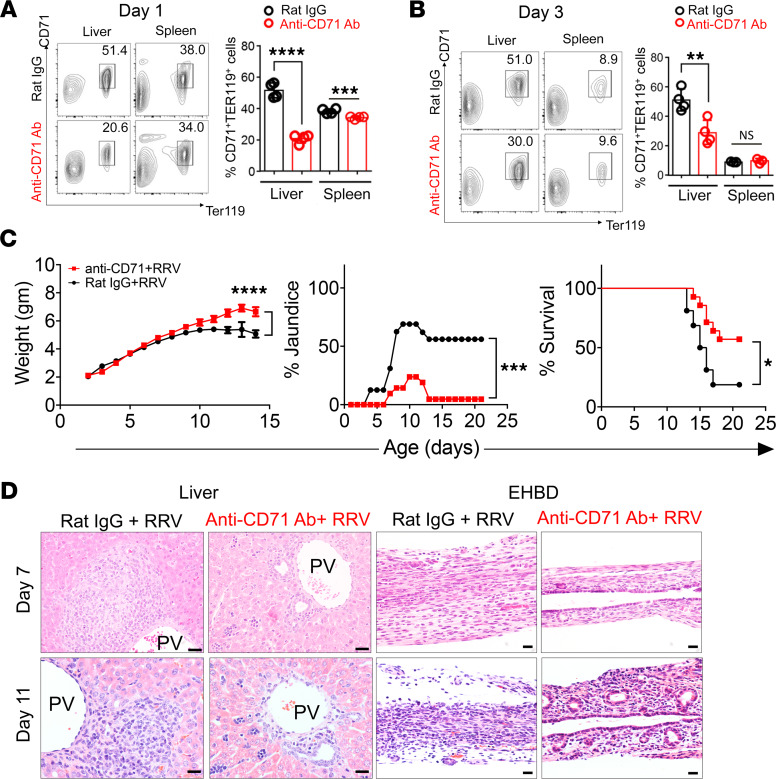
Figure 3. Phenotypic changes induced by the depletion of CD71+ cells in RRV-infected mice.
(A and B) Flow cytometry plots and graphical quantification of CD71+Ter119+ erythroblasts after anti-CD71 antibody or rat IgG injection within 12 hours of birth. Livers or extrahepatic bile ducts (EHBD) were harvested at day 1 and day 3 after injection. **P < 0.01, ***P < 0.001, ****P < 0.0001, n = 4 for each group. (C) Weight, jaundice, and survival percentage after the administration of anti-CD71 antibody or isotype (rat IgG) into newborn mice, followed by the i.p. administration of RRV 24 hours later. Two-tailed Student’s t test was used for weight comparison, and χ2 test was used for jaundice percentage. *P < 0.05, ***P < 0.001, ****P < 0.0001; Kaplan-Meier survival curve was analyzed by the log-rank (Mantel-Cox) test; n = 16 for Rat IgG group and n = 21 for anti-CD71 antibody group. (D) H&E staining of liver and EHBD at days 7 and 11 after RRV infection. n = 5 for rat IgG–treated group and n = 14 for anti-CD71 antibody–treated group. PV, portal vein. Scale bar: 20 μM.

