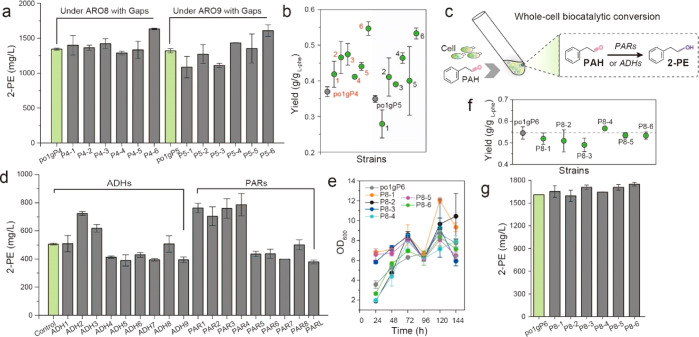
Figure 4.
Characterization of the downstream module of the Ehrlich pathway: phenylacetaldehyde reductases and alcohol dehydrogenases. (a,b) 2-PE titers and yield by rescreening l-phenylalanine specific permeases. Red 1, strain P4–1; Red 2, strain P4–2; Red 3, strain P4–3; Red 4, strain P4–4; Red 5, strain P4–5; Red 6, strain P4–6; Black 1, strain P5–1; Black 2, strain P5–2; Black 3, strain P5–3; Black 4, strain P5–4; Black 5, strain P5–5; Black 6, strain P5–6. (c) Manipulations of whole-cell biocatalytic conversion of phenylacetaldehyde. PAH, phenylacetaldehyde. (d–g) 2-PE titers, cell growth and yield of screening and identifying the optimized phenylacetaldehyde reductases or alcohol dehydrogenases. P8–1, strain po1gP8–1; P8–2, strain po1gP8–2; P8–3, strain po1gP8–3; P8–4, strain po1gP8–4; P8–5, strain po1gP8–5; P8–6, strain po1gP8–6. All experiments were performed in triplicate and error bars show standard deviation (SD).

