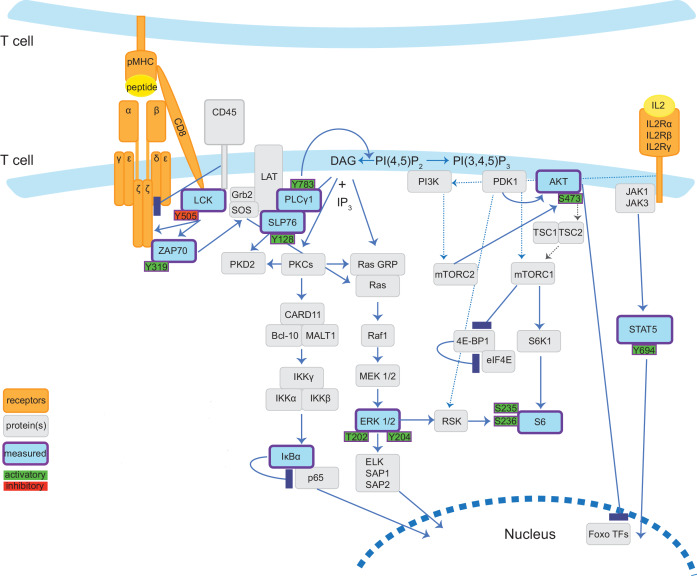
Figure 1. Diagrammatic representation of TCR signalling pathways measured by mass cytometry panel.
Cartoon depicts the TCR-related signalling pathways examined in this study in our minimal stimulation system wherein T cells present antigen to each other. Solid lines indicate evidence of direct and dotted lines suggested or indirect interaction. Signalling proteins and post-translational modifications directly measured by mass cytometry antibodies are coloured blue (proteins) or green/red (sites of phosphorylation events) and outlined in purple. The mass cytometry panel also profiled surface proteins TCRβ, CD8α, CD45, CD25 (IL2Rα), and CD44.

