. 2020 May 15;9:e53948. doi: 10.7554/eLife.53948

Figure 2. Mass cytometry measurements of signalling in singlet and doublet events.

(a) Naïve CD8+ T cells were stimulated with 1 μM peptides of various potencies for 0, 1, 2, 4 and 6 hr before profiling by mass cytometry. Histograms depict pS6 signal. (b) Bubble plots of all signalling molecules after stimulation as in (a) in mass cytometry events with 1 or 2 cell-equivalents of DNA (singlets or doublets, respectively). The size of the bubbles denotes the percentage of positive cells, and the colour denotes the centred and scaled median intensity of each positive fraction. Results are representative of cells from six biological replicates measured in two independent experiments as detailed in Supplementary file 1.

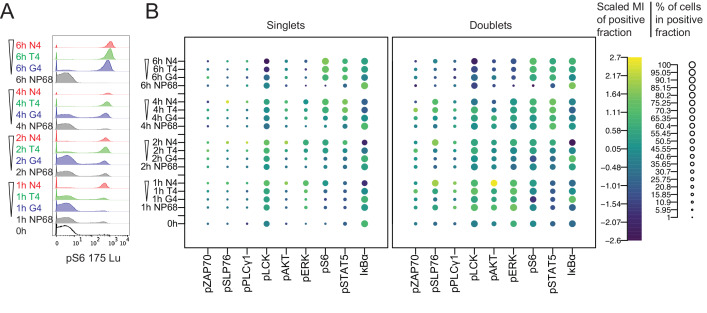
Figure 2.

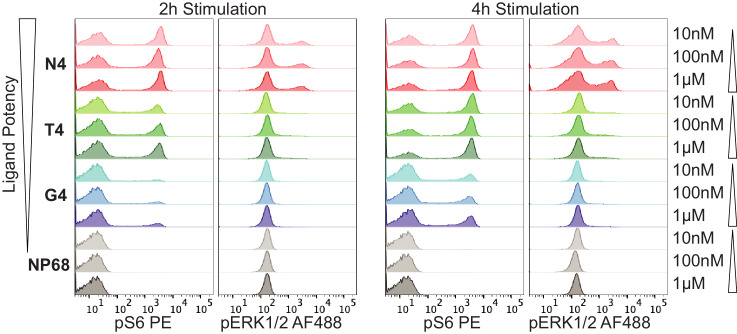
Figure 2—figure supplement 1. Titrating peptide concentration.

Figure 2—figure supplement 1.

(a) Flow cytometry measurements of pS6 and pERK after 2 or 4 hr of simulation with 10 nM, 100 nM or 1 μM of N4, T4, G4 or NP68 peptides. Results are representative of 3 biological replicates.
Figure 2—figure supplement 2. Gating based on DNA content and comparison of signalling markers.

Figure 2—figure supplement 2.

(a) Gating strategy used to select mass cytometry events containing one or two cell-equivalents of DNA from mass cytometry data in Figure 2. (b) Percentages of mass cytometry events deemed doublets (2 cell-equivalents of DNA). Plot depicts mean and standard deviation of 6 biological replicates measured in two independent experiments as detailed in Supplementary file 1. (c–d) Expression of total (c) and phosphorylated (d) protein measurements in cells stimulated with N4 peptide for 1 hr, gated on singlets (red) versus doublets (blue). Data are representative of 6 biological replicates measured in two independent experiments. (e) As (d) after normalization of signalling molecules to total DNA levels.