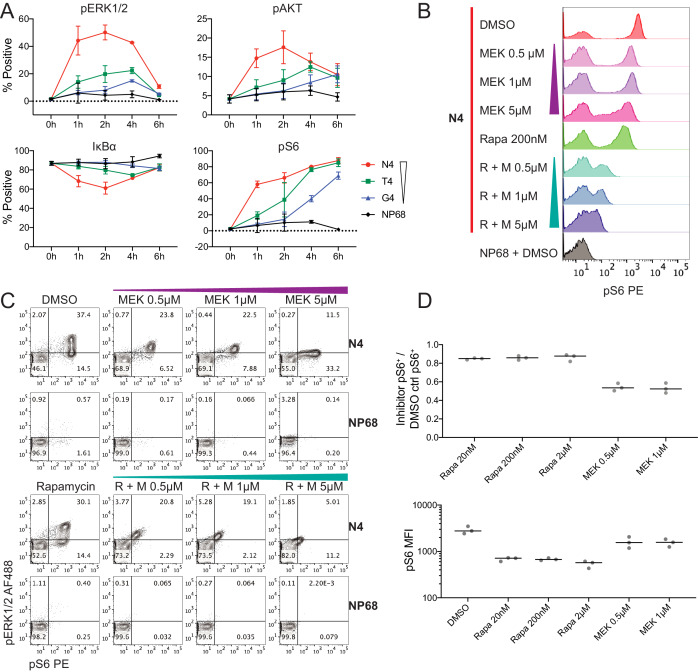
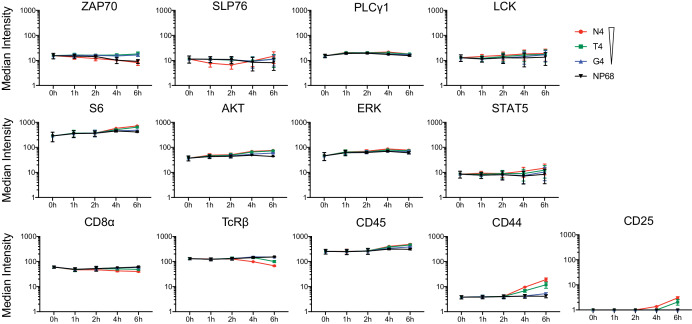
Figure 3. Kinetics of selected signalling proteins and impact of MEK and mTOR pathway inhibitors on T cell activation parameters.
(a) The percentage of cells positive for each marker is plotted against time. Results depict combined data from six biological replicates measured in two independent experiments as detailed in Supplementary file 1. Points represent the mean and error bars depict the SD. Data underlying plots are provided in Supplementary file 5. (b–c) Flow cytometry measurements of pS6[S235/236] and pERK1/2 after 2 hr of pre-treatment with DMSO vehicle control, rapamycin (Rapa) 200 nM, MEK162 (MEK) 0.5 μM, 1 μM and 5 μM, or combined rapamycin with MEK162 (R + M), followed by 4 hr stimulation with 1 μM N4 or NP68 peptides. Results are representative of 3 independent experiments. (d) The fraction of pS6+ cells in N4-stimulated conditions with the indicated inhibitor treatments versus DMSO (top). The median fluorescent intensity of pS6 among pS6+ cells in N4-stimulated conditions with the indicated inhibitor treatments (bottom). Lines represent the median. Results depict combined data from three independent experiments.


