(
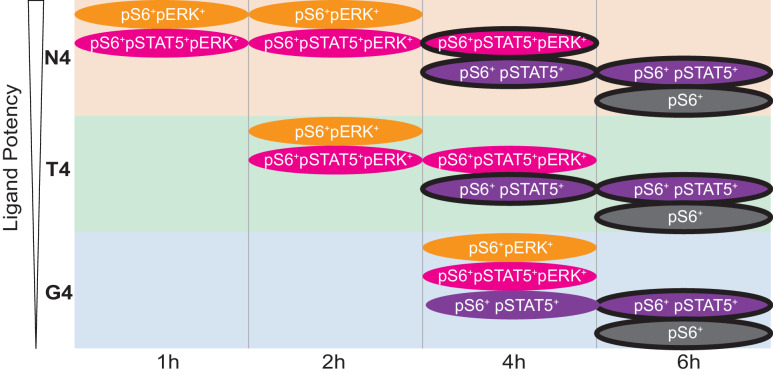
a) Mass cytometry data were grouped by biological replicate and stimulating ligand before constructing activation trajectories by ordering the cells according to pS6 intensity. Plots depict 1000 randomly sampled cells from an example replicate. Colours represent real times at which cells were sampled. (
b) Example of pERK1/2 intensity measurements along the trajectories constructed in (
a). (
c) Loess curves were fitted to intensities of the indicated markers along the trajectories depicted in (
a). Dotted lines represent the estimated standard error from the loess fits. (
d) As (
c) for additional signalling markers. Trajectories are representative of the four biological replicates that included at least three time points, measured in two independent experiments as detailed in
Supplementary file 1.


