. 2020 May 15;9:e53948. doi: 10.7554/eLife.53948

Figure 6. Simultaneous measurement of phosphorylation of S6 and mRNA expression of transcription factors Nr4a1 and Irf8.

(a) Combined phosphoflow cytometry of pS6 and RNA flow cytometry of Nr4a1 and Irf8 transcripts in naïve OT-I CD8+ T cells stimulated with N4, T4, G4 or NP68 peptides for 2 hr, gated on single live cells in which the control gene Rpl39 was detected. (b) Frequency of phenotypes depicted in (a) after stimulation for 1, 2, 4 or 6 hr. Data are representative of 3 independent experiments.

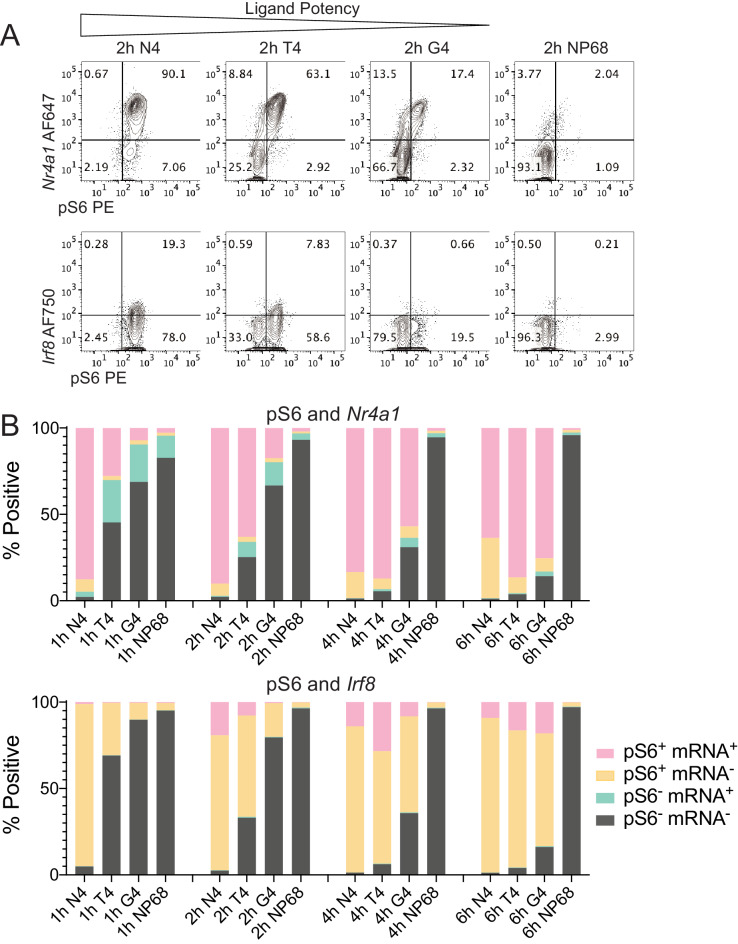
Figure 6.

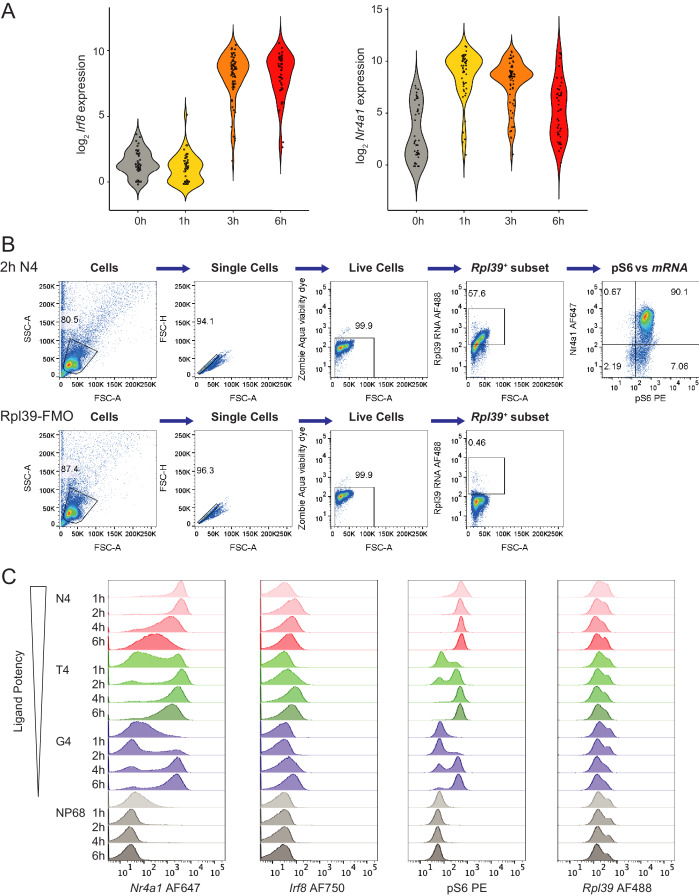
Figure 6—figure supplement 1. RNA flow cytometry gating strategy and histograms.

Figure 6—figure supplement 1.

(a) Single cell RNA-seq of Irf8 and Nr4a1 expression after 0–6 hr stimulation with 1 μM N4 peptide from previously published data (Richard et al., 2018), ArrayExpress E-MTAB-6051, depicted as violin plots, with dots indicating individual cells. (b) Gating strategy for combined phosphoflow cytometry of pS6 and RNA flow cytometry: cells were gated on size, single cells, live cells and Rpl39+ cells, before examining Nr4a1, Irf8 and pS6 with gates based on fluorescence-minus-one stains. (c) As Figure 6, histograms depict flow cytometry measurements of Nr4a1, Irf8 and pS6 (gated on Rpl39+ cells), and the control mRNA Rpl39 (gated on live cells) over all time points measured. Data are representative of 3 independent experiments.