. 2020 May 15;9:e53948. doi: 10.7554/eLife.53948

Figure 7. Signalling phenotypes in T cells stimulated with peptide-pulsed APCs.

(a) Naïve CD8+ T cells were stimulated with mature BMDCs loaded with peptides of various potencies for 1, 2, 4 and 6 hr before profiling by flow cytometry. The percentage of cells positive for each marker is plotted against time. Results depict combined data from three independent experiments. Points represent the mean and error bars depict the SD. (b) Example flow cytometry data from (a) of pERK1/2 and pS6 measured at 1 and 6 hr.

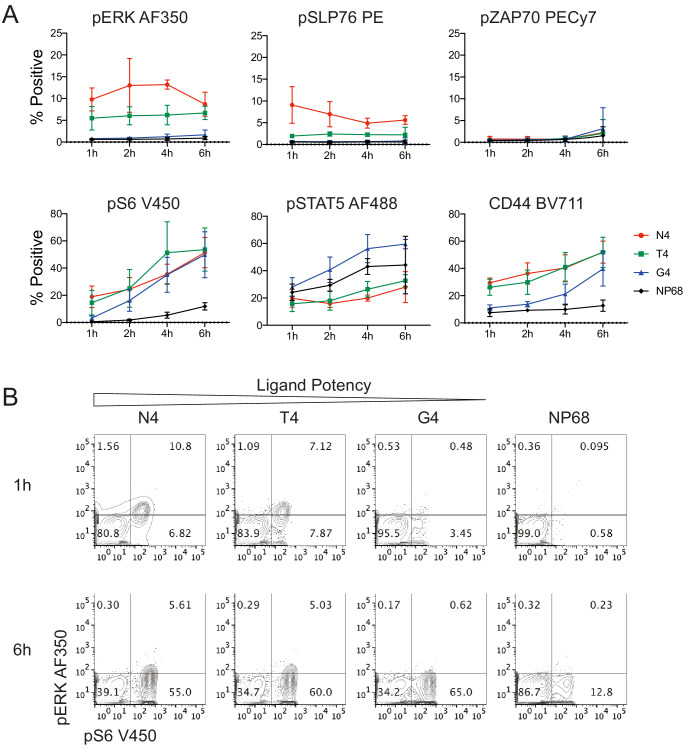
Figure 7—source data 1. Data underlying plots in Figure 7a.

Figure 7.

Figure 7—figure supplement 1. Expression of adhesion and costimulatory molecules on T cells and BMDCs.

Figure 7—figure supplement 1.

(a) Expression of CD80 and ICAM-1 on T cells after 6 hr of stimulation with 1 μM of the indicated peptides. Results are representative of 3 biological replicates measured in two independent experiments. (b) Surface protein phenotyping of BMDCs before and after maturation for 1 day with LPS. Results are representative of 5 independent experiments.