. 2020 Jun 4;9:e58130. doi: 10.7554/eLife.58130

Figure 2. RSC1 and RSC2 complexes differ in remodeling activity on a sea urchin 5S mononucleosomal substrate.

(A) Alternative RSC1 and RSC2 complexes, with the Rsc3/30 module maintained or removed during purification. Purified RSC complexes (600 ng) were analyzed on a 6% polyacrylamide SDS-PAGE gel stained with silver. The RSC1 and RSC2 complexes are from the same gel, but were moved adjacent for the depiction. (B) ATPase time course of RSC1 and RSC2 with and without the Rsc3/30 module. Values are the mean +/- standard deviation from two separate RSC preps for each RSC complex assayed in triplicate. (C) Comparative sliding of 174 bp sea urchin 5S yeast mononucleosomes (20 nM) by RSC1 and RSC2 complexes (30 nM). The nucleosomal Start (green), Slid (blue), and free DNA (grey) bands were quantified and reported as a percent of the total signal.

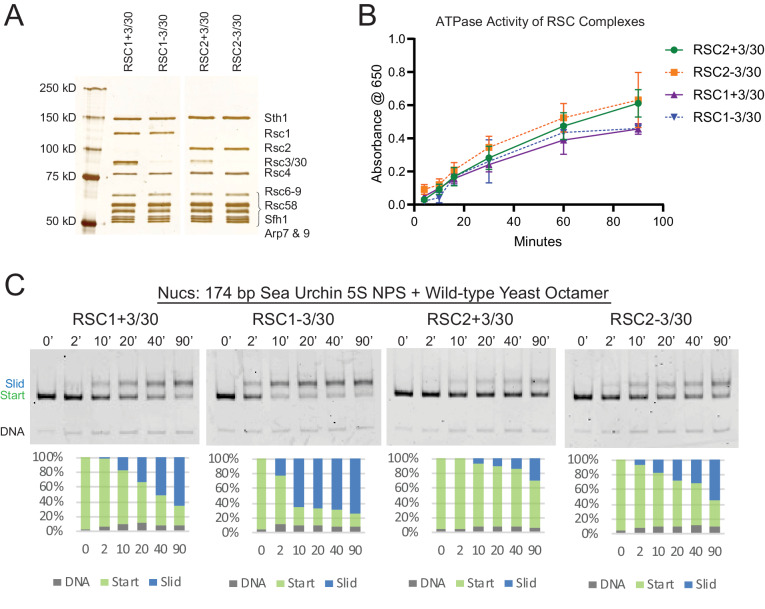
Figure 2—source data 1. ATPase time course data.
Figure 2—source data 2. RSC sliding of wt 5S yNucs.

Figure 2.

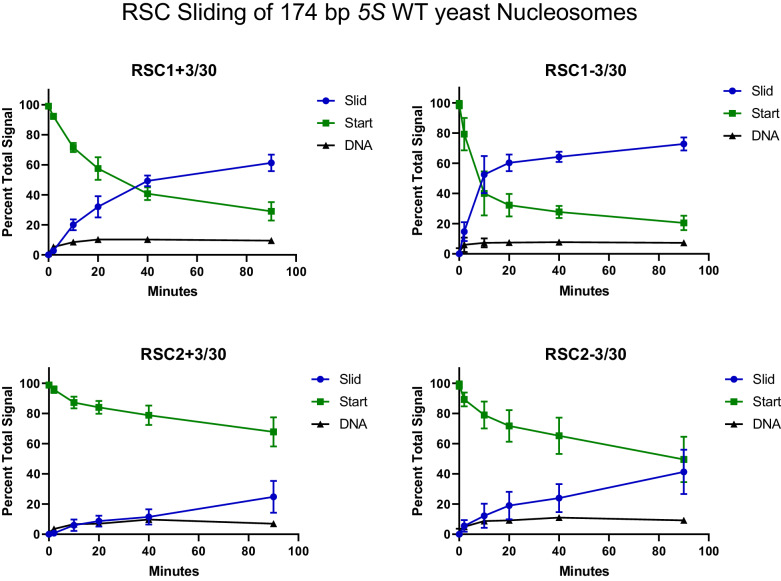
Figure 2—figure supplement 1. Quantification of RSC sliding 174 bp 5S wild-type yeast mononucleosomes as conducted in Figure 2C.

Figure 2—figure supplement 1.

Mean and standard deviation for four replicates.
Figure 2—figure supplement 1—source data 1. Quantification of RSC sliding 5S wt yNucs.
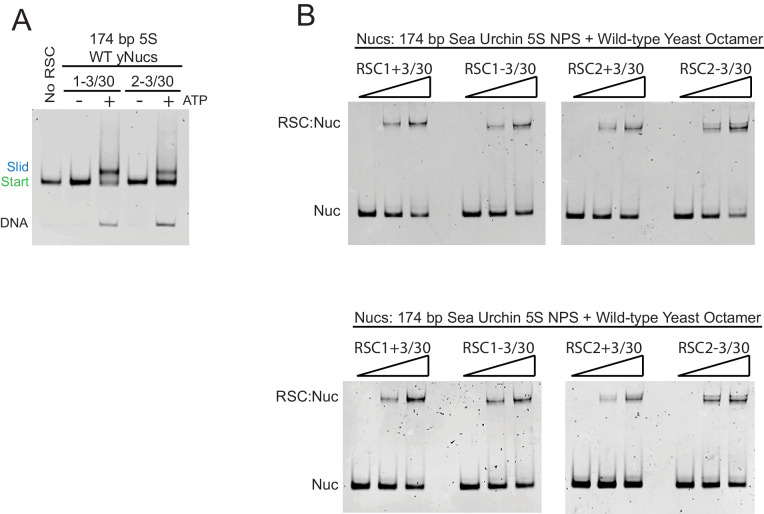
Figure 2—figure supplement 2. RSC complexes without Rsc3/30 module are ATP-dependent chromatin remodelers and RSC1 and RSC2 complexes bind similarly to 174 bp sea urchin 5S mononucleosomes.

Figure 2—figure supplement 2.

(A) RSC1 and RSC2 complexes slide mononucleosomes in an ATP-dependent manner. Mononucleosomes (20 nM) were incubated in the presence (+) or absence (-) of 1 mM ATP with 30 nM of either the RSC1-3/30 (1-3/30) or the RSC2-3/30 (2-3/30) complex for 90 min at 30°C. Experiment conducted once. (B) RSC1 and RSC2 complexes bind similarly to mononucleosomes with 174 bp sea urchin 5S DNA and wild-type yeast octamers. Nucleosomes (20 nM) were incubated with 0, 30, or 60 nM RSC for 20 min at 30°C, run on a 3.8% native polyacrylamide gel, and stained with ethidium bromide. Two technical replicates shown.
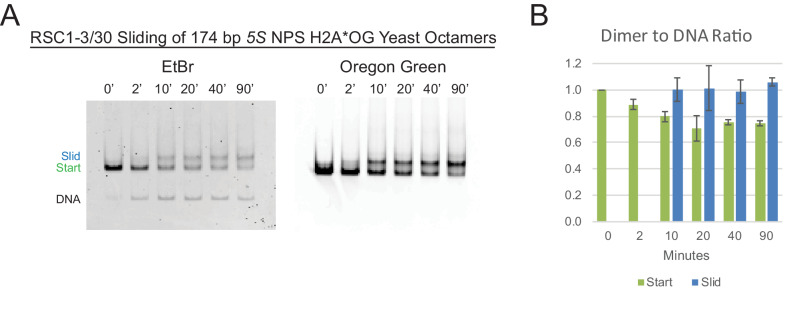
Figure 2—figure supplement 3. The RSC 5S sliding product is not the result of H2A/H2B dimer loss.

Figure 2—figure supplement 3.

(A) Nucleosome sliding by RSC1-3/30 (30 nM) of 174 bp sea urchin 5S yeast mononucleosomes (20 nM) fluorescently labeled with Oregon Green (OG) on H2A (Q114C). The native gel was scanned for OG to detect the presence of H2A, followed by staining and scanning for ethidium bromide to detect DNA. (B) The ratio of H2A/H2B dimer to DNA was calculated for each of the Start and Slid bands and normalized to the starting nucleosomal band at the ‘0’ time point. The average and standard deviation of sliding on two separate nucleosome preps were examined. The fluorescently labeled H2A*OG yeast octamers were a gift from L. McCullough and T. Formosa.
Figure 2—figure supplement 3—source data 1. Quantification of RSC1 sliding H2A-OG 5S yNucs.