. 2020 Jun 4;9:e58130. doi: 10.7554/eLife.58130

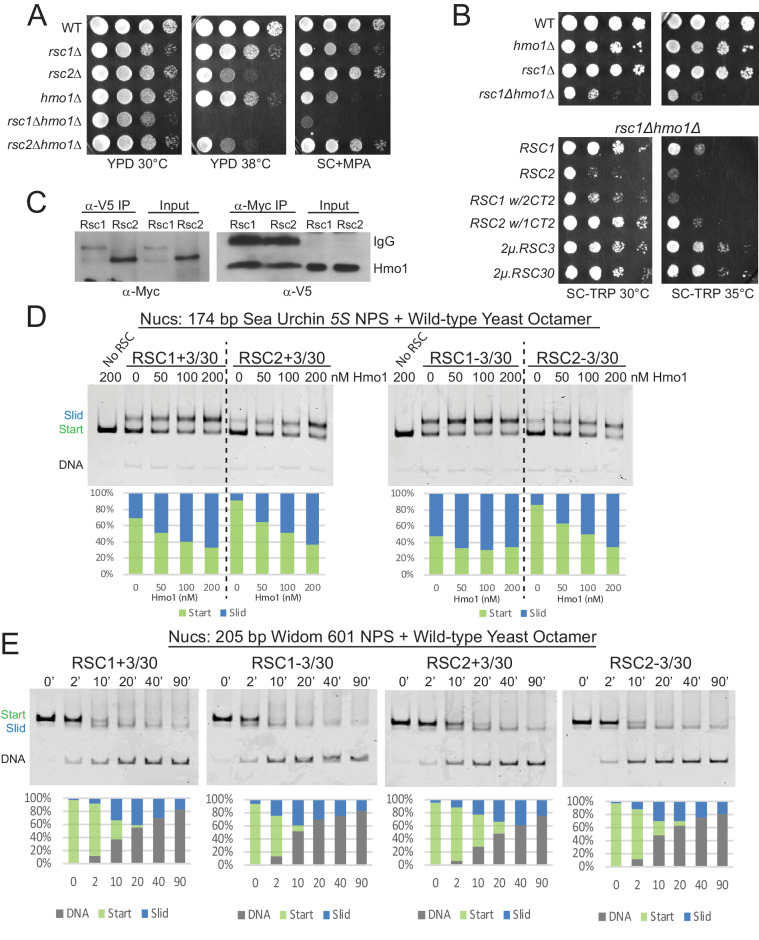
Figure 4. Hmo1 cooperates with RSC to remodel fragile or partially-unwrapped nucleosomes.

(A) An hmo1 null mutation is synthetically sick with rsc1Δ, but not rsc2Δ. WT (YBC604), rsc1Δ (YBC774), rsc2Δ (YBC82), hmo1Δ (YBC3509), rsc1∆ (YBC774), rsc2Δ (YBC82), rsc1Δ hmo1Δ (YBC3514), rsc2hmo1∆ (YBC3515) spotted as 10x serial dilutions to YPD 30°C, YPD 38°C, and SC+20 µg/ml mycophenolic acid (MPA). One of two or more biological replicates shown. (B) The rsc1Δ hmo1Δ synthetic sickness is suppressed by high copy RSC3, RSC30, or RSC1 CT2. Strain rsc1hmo1∆ (YBC3514) transformed with TRP1-marked RSC1 (p609), RSC2 (p604), RSC1 w/2CT2 (p3097), RSC2 w/1CT2 (p3098), 2µ.RSC3 (p929), 2µ.RSC30 (p911), or vector (pRS314) spotted as 10x serial dilutions to SC-TRP 30°C or SC-TRP 35°C. One of four biological replicates shown. (C) Co-IP of Rsc1 and Rsc2 with Hmo1. Sonicated chromatin extracts from RSC1.9XMYC HMO1.V5 (YBC3558) and RSC2.9XMYC HMO1.V5 (YBC3559) were immunoprecipitated using anti-Myc or anti-V5. Western blots were probed with anti-Myc or anti-V5 antibodies. One of three biological replicates shown. (D) Comparative sliding by RSC1 and RSC2 complexes (10 nM) of 174 bp sea urchin 5S yeast mononucleosomes (20 nM) pre-incubated with increasing concentrations of Hmo1 protein. Reactions were conducted at 30°C for 20 min. The Start (green) and Slid (blue) bands were quantified and reported as percent of the total signal. The free DNA band was negligible and not quantified. (E) Comparative sliding and ejection of Widom 601 yeast mononucleosomes (20 nM) by RSC1 and RSC2 complexes (10 nM). The nucleosomal Start (green), Slid (blue), and free DNA (grey) bands were quantified and reported as a percent of the total signal.

Figure 4—source data 1. Hmo1 enhances RSC sliding.
Figure 4—source data 2. RSC slides 601 wt yNucs.

Figure 4.

Figure 4—figure supplement 1. Co-Immunoprecipitation of Rsc1 and Rsc2 with Hmo1 from MNase-treated chromatin extracts.
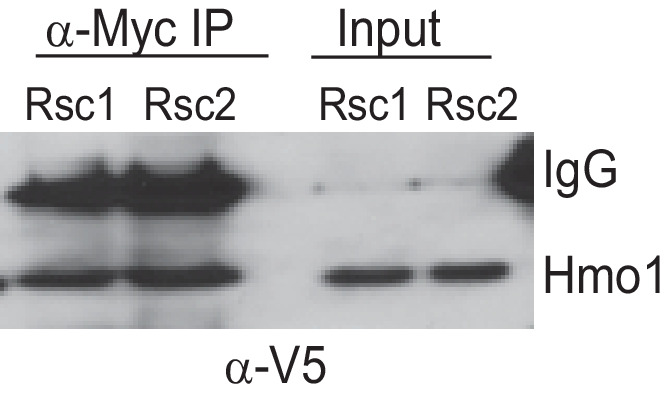
Figure 4—figure supplement 1.

RSC1.9XMYC HMO1.V5 (YBC3558) and RSC2.9XMYC HMO1.V5 (YBC3559) were immunoprecipitated using anti-Myc bound dynabeads. 100% of Co-IP and 5% of input were loaded on the gel. Western blots were probed with anti-V5 antibody. One of three biological replicates shown.
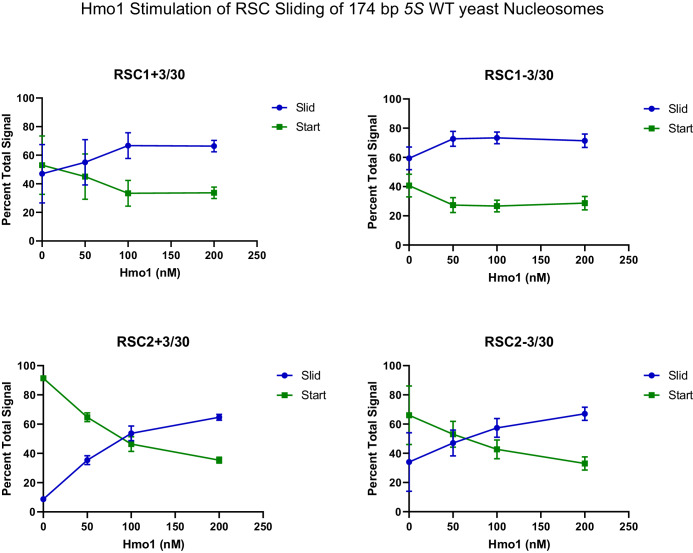
Figure 4—figure supplement 2. Quantification of Hmo1 stimulation of RSC sliding 174 bp 5S wild-type yeast mononucleosomes as conducted in Figure 4D.

Figure 4—figure supplement 2.

Mean and standard deviation for three replicates.
Figure 4—figure supplement 2—source data 1. Hmo1 stimulates 10 nM RSC sliding of 5S yNucs.
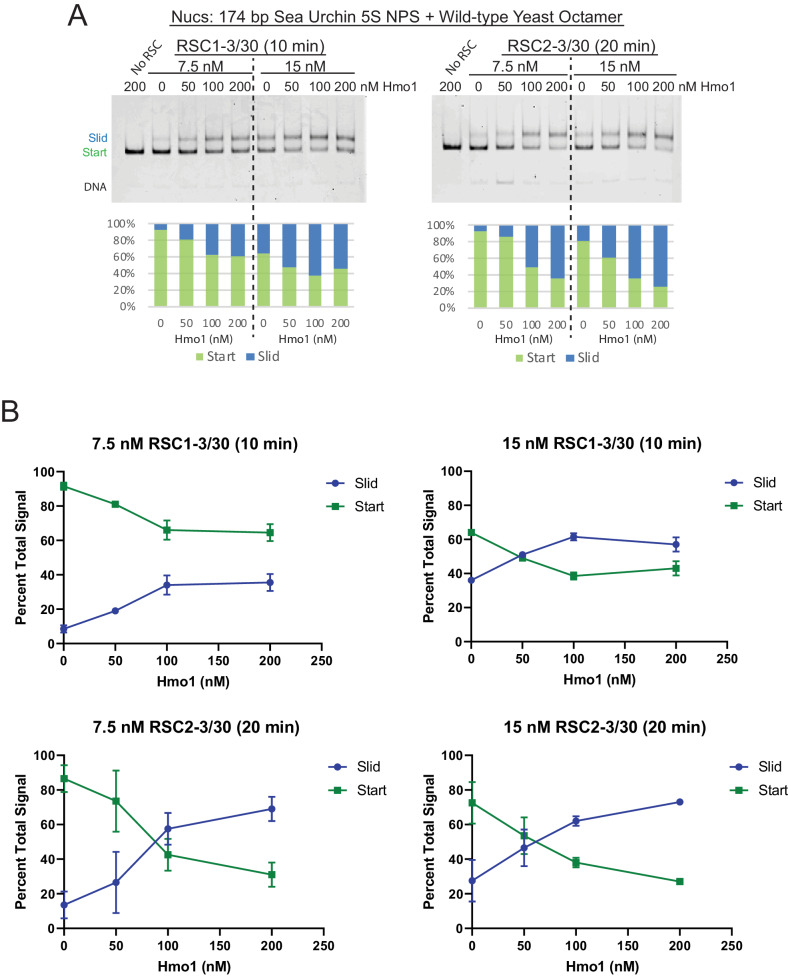
Figure 4—figure supplement 3. Additional sliding assays and quantification of 174 bp 5S yeast mononucleosomes with RSC and Hmo1.

Figure 4—figure supplement 3.

(A) 174 bp 5S yeast mononucleosomes (20 nM) were pre-incubated with increasing concentrations of Hmo1. RSC concentrations and reaction times are as indicated. All reactions were conducted at 30°C. The Start (green) and Slid (blue) bands were quantified and reported as percent of the total signal. The free DNA band was negligible and not quantified. (B) Quantification of Hmo1 stimulation of RSC sliding 174 bp 5S wild-type yeast mononucleosomes. Mean and standard deviation for two replicates.
Figure 4—figure supplement 3—source data 1. Additional Hmo1 stimulation of RSC 5S sliding.
Figure 4—figure supplement 3—source data 2. Quantification of additional Hmo1 stimulation of RSC 5S sliding.
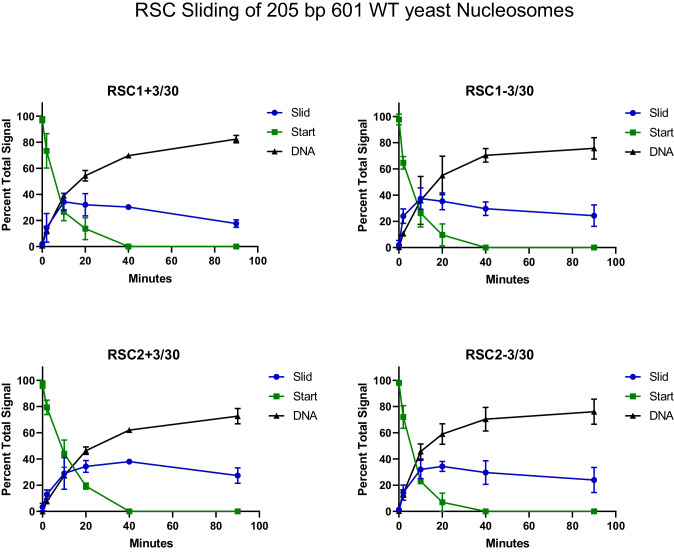
Figure 4—figure supplement 4. Quantification of RSC sliding 205 bp Widom 601 wild-type yeast mononucleosomes as conducted in Figure 4E.

Figure 4—figure supplement 4.

Mean and standard deviation for three replicates.
Figure 4—figure supplement 4—source data 1. Quantification of RSC sliding 601.
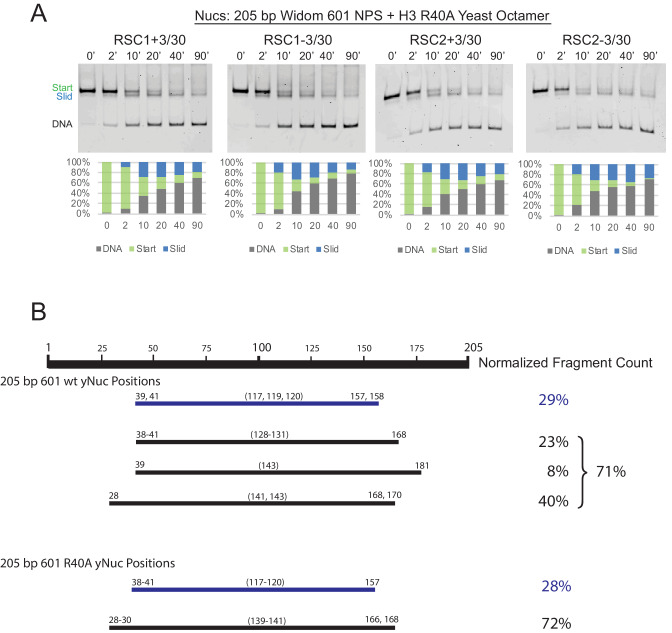
Figure 4—figure supplement 5. RSC1 and RSC2 slide Widom 601 H3 R40A mononucleosomes similarly.

Figure 4—figure supplement 5.

(A) Comparative sliding of RSC1 and RSC2 complexes (10 nM) on H3 R40A 205 bp Widom 601 yeast mononucleosomes (20 nM). The nucleosomal Start (green), Slid (blue), and free DNA (grey) bands were quantified and reported as a percent of the total signal. (B) Mapping the positions of the wild-type and H3 R40A 205 bp Widom 601 yeast mononucleosomes by ExoIII and S1 treatment as in Figure 3—figure supplement 3. Partially unwrapped nucleosome fragments (≤120 bp) are depicted in blue. More fully wrapped nucleosome fragments (≥128 bp) are in black. Averages from two technical replicates.
Figure 4—figure supplement 5—source data 1. RSC slides 601 R40A yNuc.
Figure 4—figure supplement 5—source data 2. 205 bp Widom 601 nucleosome mapping.
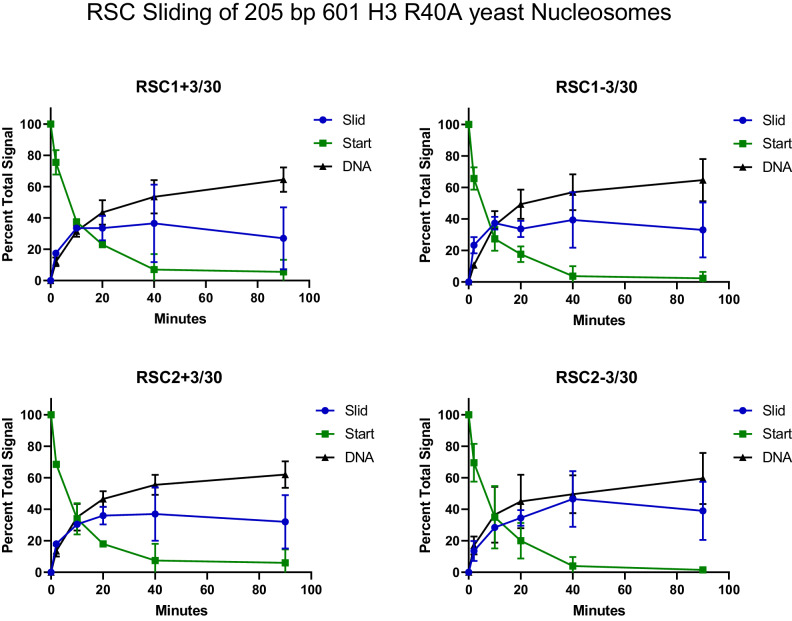
Figure 4—figure supplement 6. Quantification of RSC sliding 205 bp Widom 601 H3 R40A yeast mononucleosomes as conducted in Figure 4—figure supplement 5A.

Figure 4—figure supplement 6.

Mean and standard deviation for two replicates.
Figure 4—figure supplement 6—source data 1. Quantification of RSC sliding R40A 601 yNuc.