. 2020 Jun 4;9:e58130. doi: 10.7554/eLife.58130

Figure 5. Rsc1 and Rsc2 occupy promoters with wide NDRS, with preferential occupancy of RSC1 at tDNAs.

(A) Heat maps showing enrichment of nucleosomes, Rsc1, Rsc2, Rsc3, and Hmo1 at promoters, sorted by NDR length. (B) Violin plot of Rsc1, Rsc2, and Hmo1 occupancy at promoters at three categories of NDR length. (C) Plot of Rsc1, Rsc2, and Hmo1 occupancy compared to NDR length. (D) Plot of Rsc1 and Rsc2 enrichment by Hmo1 occupancy. (E) Heat maps showing enrichment of nucleosomes, Rsc1, Rsc2, Rsc3, and Hmo1 at all tDNAs (tRNA encoding genes). (F) Violin plot of Rsc1, Rsc2, and Hmo1 mean log2 fold enrichment at tDNAs. (G) Number of genes affected by rsc and hmo1 deletions. For each mutation the number of genes up or downregulated two fold or more compared to WT, rsc1Δ (↑129↓45), rsc2Δ (↑160↓129), hmo1Δ (↑44↓132), rsc1∆ hmo1∆ (↑838↓1028), rsc2∆ hmo1∆ (↑1336↓1131). (H) Gene Expression changes. Violin plots of RNA expression for each mutation at all pol II genes (6145 genes) and at ribosomal protein genes (132 genes) as compared to WT expression. ChIP-seq and RNA-seq data shown represents averages of two and three biological replicates, respectively.

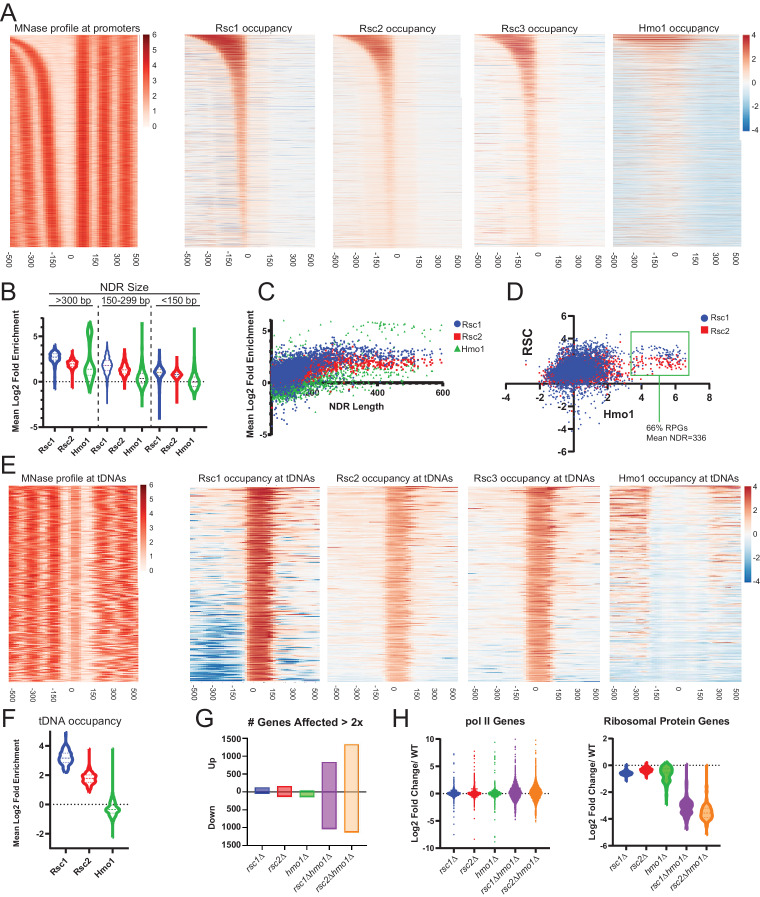
Figure 5—source data 1. Files for generation of occupancy heat maps.
Figure 5—source data 2. RSC occupancy at promoters and tDNAs.
elife-58130-fig5-data2.xlsx (815.4KB, xlsx)
Figure 5—source data 3. Differential gene expression.

Figure 5.

Figure 5—figure supplement 1. Gene expression changes in rsc1∆, rsc2∆, and hmo1∆ mutants.

Figure 5—figure supplement 1.

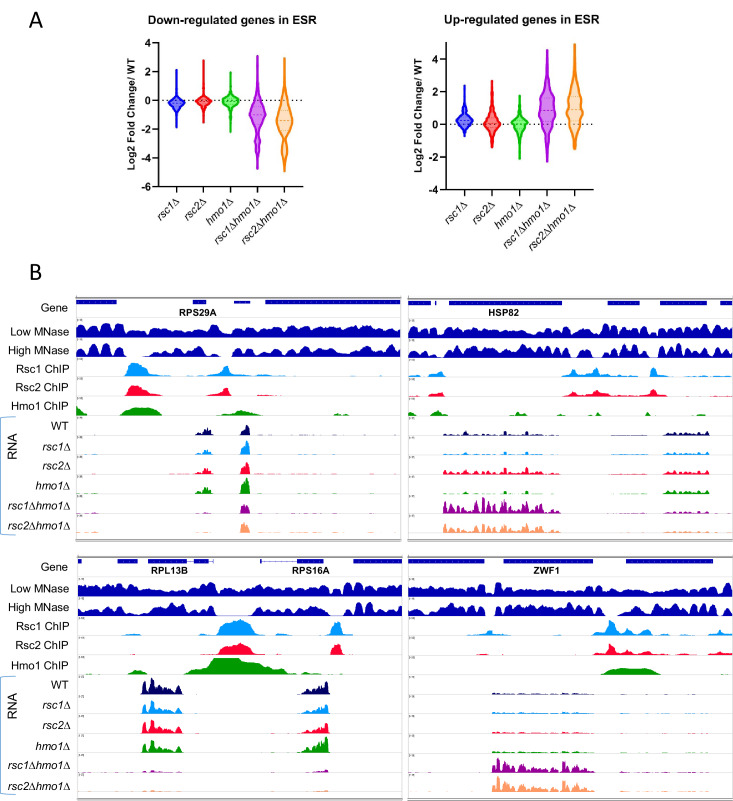
(A) The effect of rsc deletions on genes involved in the environmental stress response (ESR). Violin plot showing expression changes (average of three biological replicates) in rsc mutants for genes that are up-regulated (255 genes) or down regulated (587 genes) in the ESR (Gasch et al., 2000). (B) Genome Snapshots. Shown for select genes are low- (GSM1891202) and high- (GSM1891207) MNase digested fragment coverage from Kubik et al., 2015, Rsc1 and Rsc2 ChIP Seq log2 fold enrichments, Hmo1 ChIP Seq log2 fold enrichment (GSM1509041) from Knight et al., 2014, RNASeq coverage (unstranded) from an average of three biological replicates of RNAseq for WT(YBC604), rsc1∆ (YBC774), rsc2∆ (YBC82), hmo1∆ (YBC3509), rsc1hmo1∆ (YBC3514), rsc2hmo1∆ (YBC3515).
Figure 5—figure supplement 1—source data 1. List of ESR affected genes.
Raw sequencing data is available at NCBI under SRA accession number PRJNA573112.
Figure 5—figure supplement 2. Gene expression changes in rsc1∆, rsc2∆, and rsc30∆ mutants.

Figure 5—figure supplement 2.

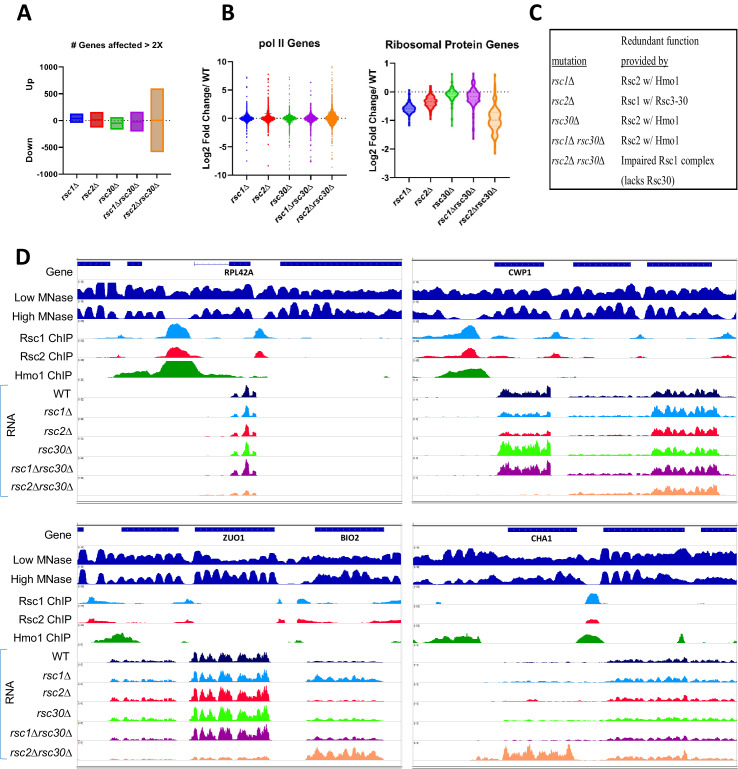
(A) Number of genes affected by rsc deletions. For each mutation, the number of genes up or downregulated two fold or more compared to WT. rsc1∆ (↑129↓45), rsc2∆ (↑160↓129), rsc30∆ (↑66↓168), rsc1rsc30∆ (↑162↓204), rsc2rsc30∆ (↑601↓589). (B) Gene Expression changes. Violin plots showing log2 fold change of RNA in mutants at all pol II genes (6145 genes) and at ribosomal protein genes (132 genes) compared to WT expression. Change in expression reflects an average of three biological replicates, Figure 5—source data 3. (C) Rsc mutation redundancy relationship. (D) Genome snapshots. Shown for select genes are low- (GSM1891202) and high- (GSM1891207) MNase-digested fragment coverage from Kubik et al., 2015, Rsc1 and Rsc2 ChIP seq log2 fold enrichments, Hmo1 ChIP Seq log2 fold enrichments (GSM1509041) from Knight et al., 2014, and RNASeq coverage (unstranded) from an average of three replicates of RNAseq for WT (YBC604), rsc1∆ (YBC774), rsc2∆ (YBC82), rsc30∆ (YBC695), rsc1rsc30∆ (YBC839), and rsc2rsc30∆ (YBC910).
Figure 5—figure supplement 3. Appearance of RSC1/RSC2 and RSC3/RSC30 in yeast evolution.

Figure 5—figure supplement 3.

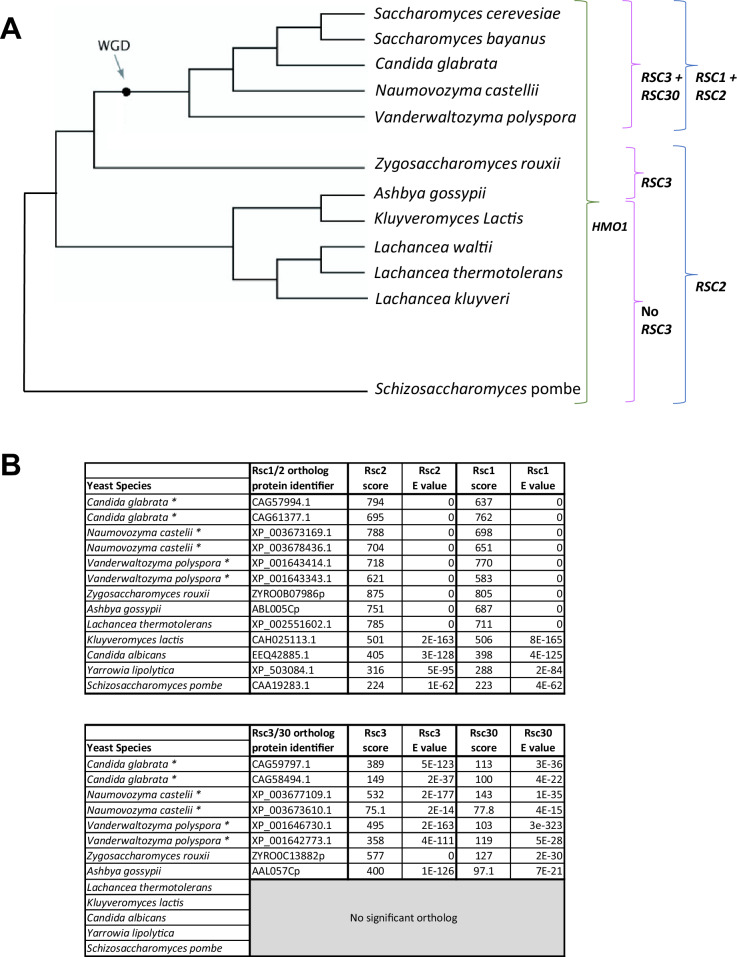
(A) Phylogenetic tree adapted from OhÉigeartaigh et al., 2011 with the appearance of RSC1/RSC2, and RSC3/RSC30. WGD refers to whole genome duplication. Duplication of RSC2 and RSC3 resulted in RSC1 and RSC30 in S. cerevisiae. While the duplicated genes in other organisms may still more closely resemble RSC2 or RSC3, RSC1 and RSC30 have been used to indicate the duplicated copy. (B) Scores from NCBI Fungal Blast for RSC1/RSC2 and RSC3/RSC30 orthologs.