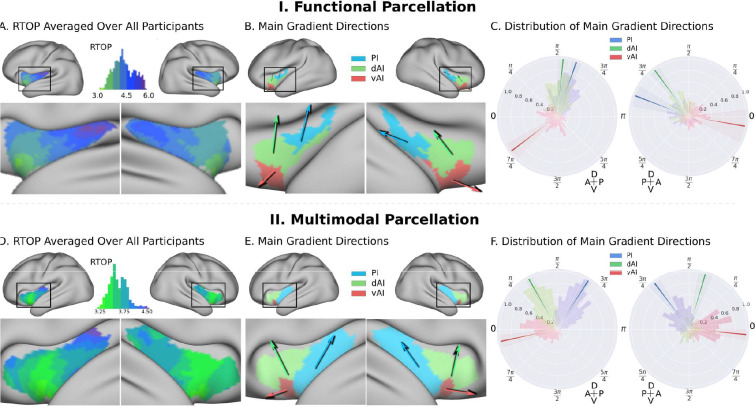
Figure 3. Insula microstructure gradients along its anterior-posterior and dorsal-ventral axes.
(A) RTOP averaged over all participants (N = 413) illustrates inhomogeneity in insula microstructure with a ventral anterior insula peak, and gradients along the anterior-posterior and dorsal-ventral gradients axes. Larger RTOP indicates smaller average compartments. There is a prominent gradient from the insular pole towards the posterior insular section. Note right hemisphere dominance. (B) Main gradient directions, computed using Rayleigh directional statistics in each functionally defined subdivision. The main directions show an anterior-to-posterior and inferior-to-superior RTOP organization in the left insular cortex and an anterior-to-posterior organization in the right insular cortex. The polar plots show the distribution of main gradient directions in each functional subdivision. (C) Gradient direction histograms. The mean direction is represented with solid lines on top of the distribution histogram; the shaded region represents the 95% confidence interval. For detailed statistics (Table S1). (D–F) Replication with an independent multimodal parcellation using HCP data (Glasser et al., 2016).

