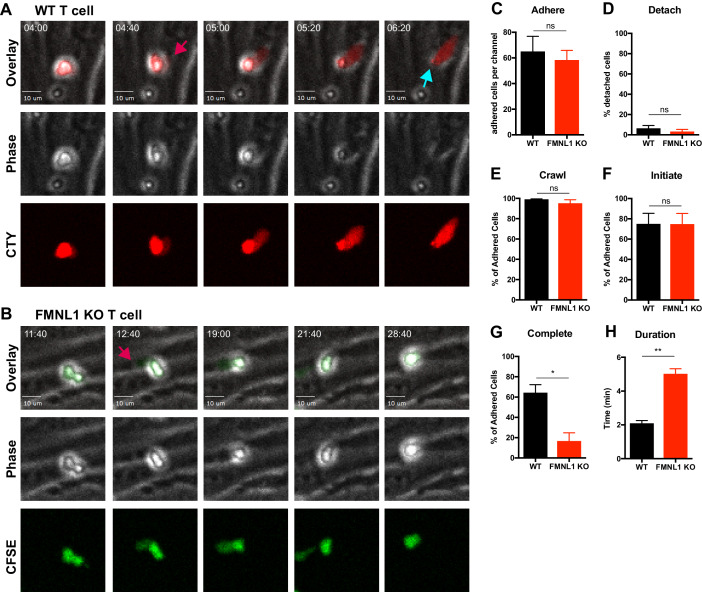
Figure 4. FMNL1 deficiency impairs T cell TEM at the diapedesis step.
Ex vivo activated CFSE or CellTrace Yellow (CTY) dye-labeled T cells were perfused into flow chambers containing bEnd.3 brain endothelial cell monolayers and kept under shear flow (2 dyne/cm2) for up to 30 min. During this time, phase contrast and fluorescence images were acquired every 20 s using a spinning-disk confocal microscope. (A) Selected time-points of a representative WT T cell during transmigration (Video 1). This transmigrating T cell undergoes trans-endothelial migration (TEM) evidenced by a stepwise darkening in the Phase contrast channel during the time-lapse. The red arrow points to the formation of membrane protrusions under the endothelial monolayer; the blue arrow points to the completion of TEM as shown by the disappearance of the phase halo. Time in min:s. (B) Selected time-points of a representative FMNL1 KO T cell attempting transmigration (Video 2). The red arrow points to the formation of membrane protrusions under the endothelial monolayer. However, this FMNL1 KO T cell never completes TEM as evidenced by the preservation of the phase halo. Time in min:s. (C) FMNL1 deficiency does not alter the ability of T cells to adhere to the endothelial monolayer. Number of T cells adhered to the endothelial monolayer. (D) FMNL1 deficiency does not affect T cell detachment from the endothelial monolayer. Percentage of adhered T cells that detached from the endothelial monolayer. (E) WT and FMNL1 KO T cells have similar crawling behavior. Percentage of adhered T cells that crawled on the endothelial monolayer. (F) FMNL1 deficiency does not impair the ability of T cells to attempt TEM. Percentage of adhered cells that attempted TEM as evidenced by extension of membrane protrusions underneath the endothelial monolayer. (G) FMNL1 deficiency strongly impairs the ability of T cells to complete TEM. Percentage of adhered cells that completed TEM as evidenced by complete loss of the phase halo. (H) FMNL1 deficiency prolongs TEM duration. For cells able to complete TEM, the time in minutes from first attempt to completion was quantified. Statistics in C-H calculated using two-tailed paired t-tests. Data in C-H are the mean ± SEM from 3 independent experiments with >100 cells analyzed per experiment. n.s. = not significant, *=p < 0.05, **=p < 0.01.

